Category Archives: elections

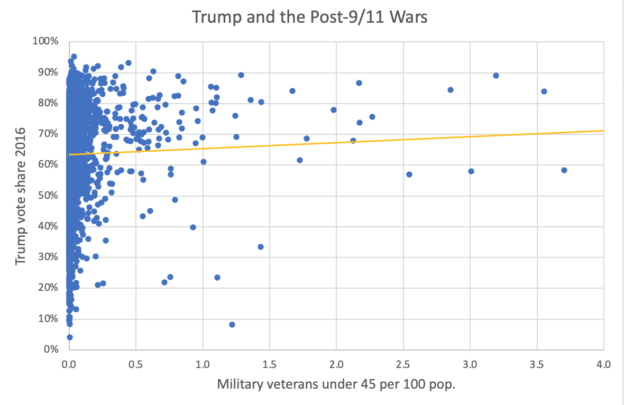
Scatterplot of counties with % of veterans under 45 and % of Trump vote in 2016, showing a modest correlation.

the post-9/11 wars and Trump

The image that accompanies this post is my graph of US counties.* The y-axis is Trump’s share of the vote in 2016. The x-axis is the percentage of each county’s population that consisted of veterans under the age of 45 in 2020. I chose that statistic as a rough proxy for direct involvement with the wars in Iraq and Afghanistan. The correlation is modestly positive and statistically significant.

When I ran a regression to predict Trump’s 2016 vote in each county based on 1) the proportion of young veterans, 2) the degree to which the county is rural, 3) the proportion of the county that is non-Hispanic white, and 4) the proportion of the population that was born overseas, all of those variables except the last one were statistically significant and positive. That means that, after controlling for race and community type, the proportion of young veterans still predicts the Trump vote.

This is merely a cross-sectional relationship, and it would be worth introducing a temporal dimension by investigating whether and how votes changed as the post-9/11 wars unfolded.

The pattern that I show here is compatible with several hypotheses. For example, maybe some communities’ cultures and demographics inclined them both to military service and to supporting Trump, or maybe deep disillusionment with the wars turned some people toward Trump in 2016 because he purported that he had opposed US involvement.

I will not claim that the basic relationship shown here is very strong, and I share it mainly for full disclosure rather than to support an argumentative position. (I wouldn’t try to use the regression as the basis of a professional article.) Yet I continue to suspect that blowback from two protracted military disasters is one cause of our current political discontents.

Americans’ assessments of these wars are filtered through ideology and probably fall into at least three categories:

  1. The invasion of Iraq was imperialistic and intended to favor multinational corporations; thus it was unjust from the start.
  2. The invasions were altruistic, aimed at exporting human rights and democracy; and as such, they wasted US lives and resources. OR
  3. The defeats represent corruption or decadence that must be addressed by making the USA “stronger.”

Any of those views is compatible with deep distrust of US elites, and perhaps above all of Democratic Party leaders who supported the wars. Meanwhile, MAGA Republicans benefit from both 2 and 3.

*The graph doesn’t display about a dozen outlier counties that have very high veteran populations. See also the 2020 election in the shadow of the Iraq War; the impact of post 9/11 war on our politics, etc.
youth voting backlash

The New York Times‘ Neil Vigdor cites two research findings from my Tisch College colleagues in his article entitled, “Republicans Face Setbacks in Push to Tighten Voting Laws on College Campuses.”

First:

Between the 2018 and 2022 elections in Idaho, registration jumped 66 percent among 18- and 19-year-old voters, the largest increase in the nation, according to the Center for Information and Research on Civic Learning and Engagement. The nonpartisan research organization, based at Tufts University, focuses on youth civic engagement.

And then:

Nearly 59 percent of students at traditional colleges in New Hampshire came from out of state in 2020, according to the Institute for Democracy and Higher Education at Tufts.

The main thesis of the article is that Republican state legislators are introducing legislation to make voting harder for young people or for college students, particularly in states where the youth and/or college vote has been strong lately. However, only some of these bills have passed. For example, Idaho banned using student ID cards for voting, but a New Hampshire bill that would have required student voters to prove that they pay in-state tuition died in committee.

Since the 2002 election, we have consistently analyzed the youth vote and been able to show that it is especially consequential in some states and in some races. Our research has challenged the traditional view that youth never vote much, which discourages campaigns from contacting youth–a classic vicious cycle. Generating data about young voters seems essential for encouraging turnout, but when there’s good news, sharing it may sometimes trigger backlash. It’s encouraging to see some successful resistance.

encouraging working class candidates

The quote below is from an article in The Hill by Alberto Ramos, director of talent development at New Politics. He says he “was raised by a gritty, single mother of three in a trailer park on the eastern desert outskirts of Las Vegas. Every day, we scraped and struggled to get by, but thanks to her perseverance and determination, we survived.” Now he works to encourage people from similar backgrounds to run for political office:

Peter Levine, Associate Dean at Tufts University conducted a survey of over 700 candidates for local office in 2021 …. He asked about the degree to which concerns over credentials, fundraising networks, economic hardship, or public scrutiny might cause an otherwise viable candidate to hesitate to run. The starkest differences appeared when factoring in childhood economic adversity.

Almost half of the people who experienced poverty and received welfare when they were children — regardless of their race, gender, or level of education — doubted their credentials were good enough, compared to only 15 percent of those who never had. One-third of those who received welfare as children were anxious about even being able to afford a run for office, compared to a mere six percent of their peers who never had.

Some forms of disadvantage are being slowly and arduously addressed. The proportions of women, people of color, and sexual minorities among elected politicians are rising. The same is not true of social class. The proportion of working-class members of state legislatures declined from an already low rate between 1960 and 2010 (Carnes 2018). Our survey is meant to inform efforts to turn that trend around.

See also: Challenges Reported by Candidates for Local Office; class inversion as an alternative to the polarization thesis; and social class inversion in the 2022 US elections.

social class inversion in the 2022 US elections

I’ve argued that democracy is dangerously threatened when influential left parties rely on upper-income voters and influential right parties depend on working-class support. In such cases, the left parties block significant progressive change and frustrate disadvantaged constituencies, while the right shifts from libertarian to chauvinist policies.

There is evidence of this class inversion in many democracies, including (among others) France and Germany. In the US, the inversion is partial, because race, income, and education push in different directions. This partly explains the incoherent positions of both major parties. Democrats draw highly educated whites and people of color; Republicans attract whites at both ends of the socioeconomic scale.

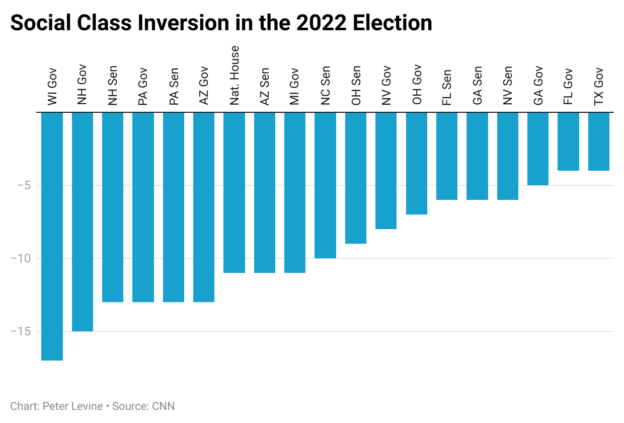
I have graphed the difference between Democratic support among college graduates and non-college graduates by state and candidate in 2022. If college is a proxy for the upper portion of the socioeconomic scale, then Democrats should perform better among non-college graduates, but the opposite happened in every case.

At a national scale, the Democrats won a majority of voters with college degrees (54%), but a minority of those without college degrees (43%). That 11-point gap is evidence of one kind of class inversion. On the other hand, the Democrats won a majority of voters with household incomes below $50,000 (52%) and a minority of those above that threshold (45%) and above $100,000 (46%). They drew half the white college graduate vote (50%), just 32% of the white non-college vote, and 68% of people of color with or without college degrees. Again, the picture is mixed.

There were some interesting differences by state. The class inversion was most pronounced in Wisconsin, where Gov. Evers won 62% of the college vote and 45% of the non-college vote on his way to reelection: a 17-point gap. Evers drew the support of only 37% of white voters without college degrees, 59% of white voters with college, and 83% of voters of color, regardless of education.

In the Ohio and Pennsylvania Senate races, the Democratic candidates explicitly courted working-class voters of all races. These campaigns were experiments in reversing the class inversion. Both Democrats lost non-college voters, and neither performed much differently from the national average with that demographic group. (Ryan got 34% of non-college white votes; Fetterman got 38%.) Of course, they had different opponents. JD Vance made an explicit pitch to non-college whites in Ohio that may have worked for him, whereas Mehmet Oz lost overall in Pennsylvania.

In Michigan, traditionally a blue-collar state, the Democrats performed very well. The interplay of class and race was particularly evident in that state’s results, with Gov. Whitmer drawing 42% of non-college whites, 60% of college whites, and 82% of non-college people of color. In other words, she reflected the Democrats’ formula of educated whites plus all people of color. That formula can win elections but makes Democrats dependent on an upscale portion of their electorate.

In Florida, the Republicans simply performed better than in other states. The demographics there are also somewhat unusual. The Exit Polls report all people of color as one category, and in Florida, that means more Latinos than in some other states. Notably, DeSantis won almost half of voters of color with college degrees (48%), who represented 14% of the state’s electorate. But he got 70% of white voters without college.

See also: class inversion as an alternative to the polarization thesis; social class in the French election;

the 2022 youth vote

Joe Biden today: “I especially want to thank the young people of this nation who, I’m told, voted in historic numbers again, and just as they did two years ago.”

For much detail on the youth vote, follow CIRCLE on Twitter, @civicyouth, or on their Election Center website. New analysis is appearing regularly. Some highlights so far:

  • “youth (ages 18-29) are the only age group in which a strong majority supported Democrats.”
  • “89% of Black youth and 68% of Latino youth voted for a Democratic House candidate. Among white youth, the vote was 58% for Democrats and 40% for Republicans.”
  • “In the Pennsylvania Senate race, where Democrat John Fetterman won by a slim 3% margin, youth ages 18-29 preferred Fetterman 70% to 28%, compared to 55% to 42% among voters ages 30-44, with voters over 45 preferring Republican candidate Dr. Oz.”