My colleagues at the Institute for Democracy and Higher Education here at Tisch College have released their national report on the 2018 election and sent detailed specific reports to each of the roughly 1,031 colleges and universities that participate in our National Study of Learning, Voting, and Engagement (NSLVE). This research is based not on surveys (which have errors in sampling and self-reporting), but on official voting records for about 20 million people.
As reported in today’s Washington Post, the headline is that college student turnout more than doubled between 2014 and 2018 (the last two midterm elections). It’s true that everyone’s turnout grew in 2018, but college students far surpassed the national trend. My favorite statistic is that turnout rose on 99% of all the NSLVE campuses. Now that is a significant pre-/post- change.
The full report has much more detail on demographic groups, profiles of selected colleges, and suggestions for maintaining the momentum. As always, the actual result (40% of college students voted in 2018) remains too low, but the only way forward is by raising engagement one step at a time, and doubling it is a good step.
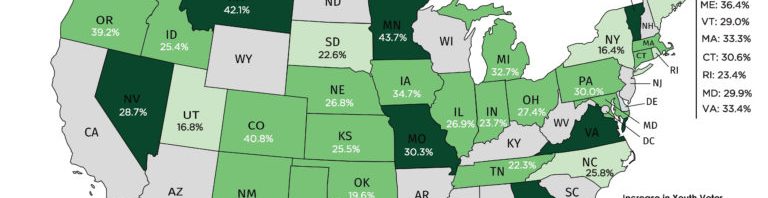
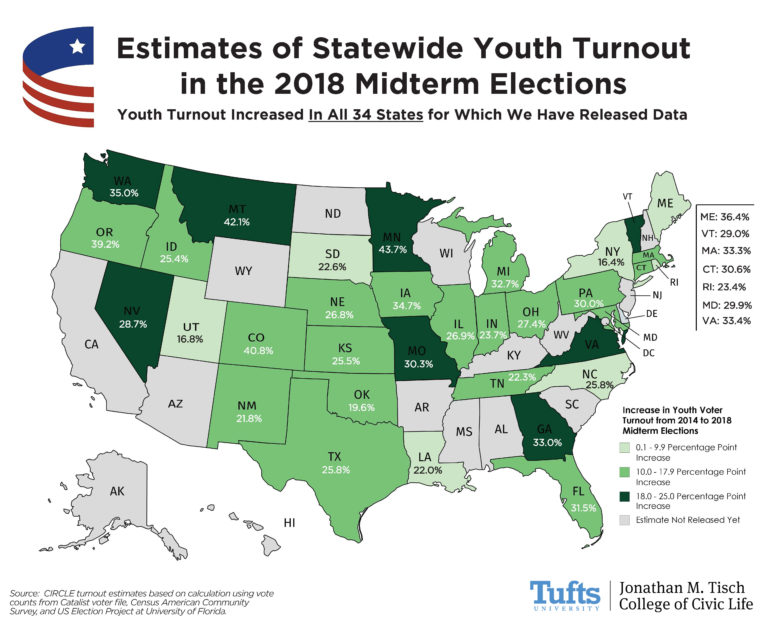
CIRCLE’s latest analysis finds that youth turnout increased in all 34 states for which data are now available. For example, youth turnout tripled in Texas, more than doubled in Tennessee, and rose by 20 points in Georgia. Maine already had one of the highest youth turnout rates in the country but still saw an increase. More at the CIRCLE site.
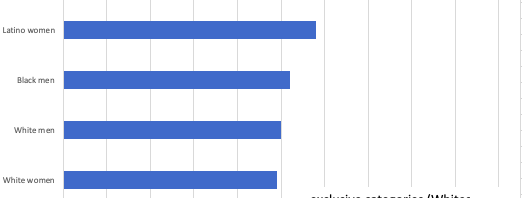
According to CIRCLE’s latest analysis of its own survey data, young people who were contacted by candidates and parties in the 2018 election cycle were much more likely to vote. Some of this is probably selection-bias: campaigns try to contact the most likely voters. But there is also accumulated evidence that contact is effective: it boosts turnout, even for low-propensity voters.
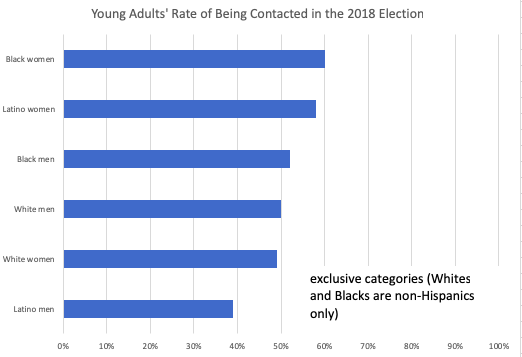
Democrats contacted substantially more youth than Republicans did in 2018. Demographics influenced who received the most contact:
These differences do not track disparities in political power and SES. On the contrary, young Black women generally face compounded disadvantages in America, yet 60% were contacted in 2018 (presumably by Democrats, for the most part). They top the list. Meanwhile, young white men were ten points less likely to be contacted.
What does this mean? It all depends on the nature of the contact and the follow-up. If Democratic candidates were simply trying to mobilize a reliable segment of their base by sending one-way messages before the election, and if African American women don’t hear from politicians again until October 2020, then the graph demonstrates political opportunism.
On the other hand, if the contact involved some listening and learning by campaigns, and if elected officials now recognize their debt to Black women and continue to engage them between elections, then the graph offers grounds for optimism.
I wouldn’t bet on the more optimistic interpretation, but it’s something to work for.
It’s also worth focusing on young Latino men, who really are left behind. I think this is partly because they are (for the most part) less involved in conventional organizations where people can be found and reached. In social science jargon, they have less “social capital” than the other categories of young Americans.
Finally, I don’t think it’s good news that’s young white men were contacted at low rates. From a partisan Democratic perspective, it could be a reasonably good sign. Democrats, who did most of the outreach to youth in 2018, directed their resources to people of color for a mix of tactical and principled reasons. But we also know that many young white men live in “civic deserts,” where they are generally disconnected from civic and political institutions. That can reinforce combustible forms of alienation. If the low contact rate reflects low levels of membership and belonging, it is evidence of a problem.
(UCLA) On Feb. 11, Martin Wattenberg posted a Washington Post Monkey Cage article that received the headline, “In 2018, the turnout gap between young and old people didn’t really shrink at all.” He wrote,
No doubt this CIRCLE study is correct in asserting that the turnout rate of young Americans increased markedly in 2018, compared with recent midterm elections. But so did the turnout rate of all other age groups.
The crucial question, then, is this: Did 2018’s massive increase in turnout reduce the wide gap between the turnout rates of young and old Americans?
No. Official records of participation in three states between 2006 and 2018 show that this was not the case.
Wattenberg is not wrong that everyone’s turnout rose in 2018, presumably because Donald Trump raised the perceived stakes of politics and nationalized congressional elections. But it is noteworthy that young people at least kept pace with the average increase, because low youth turnout in midterm elections had hitherto been a very stable pattern.
Furthermore, if you look carefully at the graphs in Wattenberg’s article, the upward slope for youth turnout is actually steeper than that for other age groups. Not vastly steeper, but notably so.
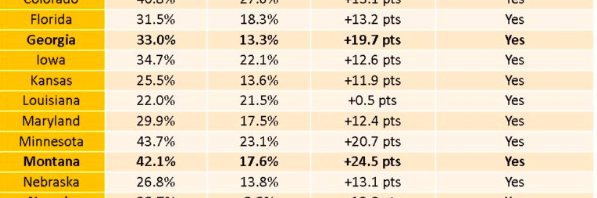
In 15 of the 17 states, youth turnout rose faster than older people’s turnout, meaning young voters expanded their share of the electorate. In certain closely contested races, the increase was dramatic–for instance, youth turnout more than doubled in Georgia and Montana.
In my view, a young-adult turnout rate of 31% is unacceptably low, but the only way to get to a reasonable level is by raising it one election at a time. A 10- or 11-point gain in one year is a very substantial step in the right direction, and it already made a difference to the results.
According to my colleagues at CIRCLE (based on their own original survey),
Almost two-thirds (64%) of youth said they had paid ‘some’ or ‘a lot’ of attention to news about the Parkland shooting.
Young people who said they were actively involved with or at least agreed with the post-Parkland movement were 21 percentage points more likely to self-report that they voted in the 2018 midterm elections.
Young people who reported being actively involved in the movement were more likely to say they were contacted by a campaign both before October AND and in the last six weeks before the election.
Among all 18 to 24-year-olds, 43% percent said that the Parkland shooting influenced their vote choice for Congress and in local elections at least “somewhat,” with 20% saying that it affected their decision “a lot.”
One reason youth involved in anti-gun-violence activism voted at a higher rate may have been their efforts to engage their own peers in voting. Of those who supported the movement, 44% said they had tried to convince others to vote in 2018.
As always, read the whole thing on the CIRCLE site.