Category Archives: Uncategorized

the new elite is like the old elite

There is much writing–from a variety of ideological perspectives–about a new elite that is said to dominate culture, politics, and the economy. This group obviously bears a resemblance to previous elites (and disproportionately descends from parents who were wealthy and powerful), but perhaps it demonstrates some new features.

Among the novel characteristics could be: high education and technical skills (as opposed to deriving wealth from physical property), a meritocratic ideology, competitiveness and addiction to work, a tendency to cluster together in specific neighborhoods of selected cities and to marry only people of the same group, and a tilt toward center-left parties, which are said to be losing their working-class base in reaction to the dominance of meritocratic elites.

For instance, David Brooks writes:

The class structure of Western society has gotten scrambled over the past few decades. It used to be straightforward: You had the rich, who joined country clubs and voted Republican; the working class, who toiled in the factories and voted Democratic; and, in between, the mass suburban middle class. … But somehow when the class conflict came, in 2015 and 2016, it didn’t look anything like that. Suddenly, conservative parties across the West—the former champions of the landed aristocracy—portrayed themselves as the warriors for the working class. And left-wing parties—once vehicles for proletarian revolt—were attacked as captives of the super-educated urban elite. These days, your education level and political values are as important in defining your class status as your income is.

I found this story perfectly plausible but wanted to examine it empirically. Therefore, I explored it using data from the General Social Survey (GSS). In brief, I do not see evidence that today’s elite have different ideological or partisan leanings from their predecessors nearly fifty years ago, nor have they diverged from non-elites in terms of work hours, religion, or geographical mobility. They are more educated and more racially diverse than elites were in the 1970s, but overall, they look very much like their predecessors. That means that we are not experiencing a scrambling or a situation that has “suddenly” developed. Rather, critiques of a liberal-leaning, highly educated elite have been pretty consistent since the days of Richard Nixon, Spiro Agnew, George Wallace, and Pat Buchanan.

Method: The GSS categorizes jobs by prestige, based on a survey of representative Americans. In 2012, respondents rated a street corner drug dealer and a panhandler lowest (at 1.9 and 2.1, respectively) and a college or university president and a physics professor highest (at 7.1 and 7.2). [Correction: physicians are highest, at 7.6] A lawyer was rated 6.4; a mechanical engineer, 6.6; and a board member of a large company, 6.8 (Smith & Son 2014).

I isolated people who either held jobs in the top tenth of the prestige scale or else were married to people in the top tenth. Although it matters whether one is the worker or the spouse, I was interested in high-status households and wanted to include partners, especially in the 1970s.

I could have defined the “elite” in different ways. Trying various definitions would be valuable. However, it is important not to select on the dependent variable. In this case, one could define the elite as people who are liberal, live in major metro areas, hold advanced degrees, and meet other criteria assumed by commentators like Brooks. But then the conclusion would be foreordained. With equal validity, one could identify survey respondents who are conservative, religious, and powerful and tell a story about them. To avoid this form of bias, I pre-selected a definition of “elite” and then examined this group empirically. To be honest, I was surprised by how little change I observed.

Here are some comparisons and contrasts between the most-prestigious households in the 1970s and the 2010s.

Education: Today’s elite (as defined above) is more educated. Seventy-two percent hold at least a bachelor’s degree, up from 58% in the 1970s. Less than one percent don’t have a high school diploma, down from 6% in the 1970s. The non-elite also have more education than they did in the 1970s; however, just 24% hold a bachelor’s degree or more.

At the same time, a graduate degree certainly does not guarantee admission to the elite. Sixty-four percent of people with graduate degrees are not in the top tenth by occupational prestige.

Demographics: The elite was 93% white in 1970, six points whiter than the non-elite at the time. Both groups are now more diverse, but the change has been faster among the elite (who started at a very white baseline). In the 2010s, 80% of the elite was white, 8% was African America, and 12% belonged to other racial groups.

Party and ideology: Elites have not moved toward the Democrats. Including independents who lean toward either party, the elite has gone from 47% Democrat and 39% Republican in the 1970s to 47% Democrat and 37% Republican in the 2010s. They already leaned Democratic in the days of Richard Nixon, and still do by an almost identical margin.

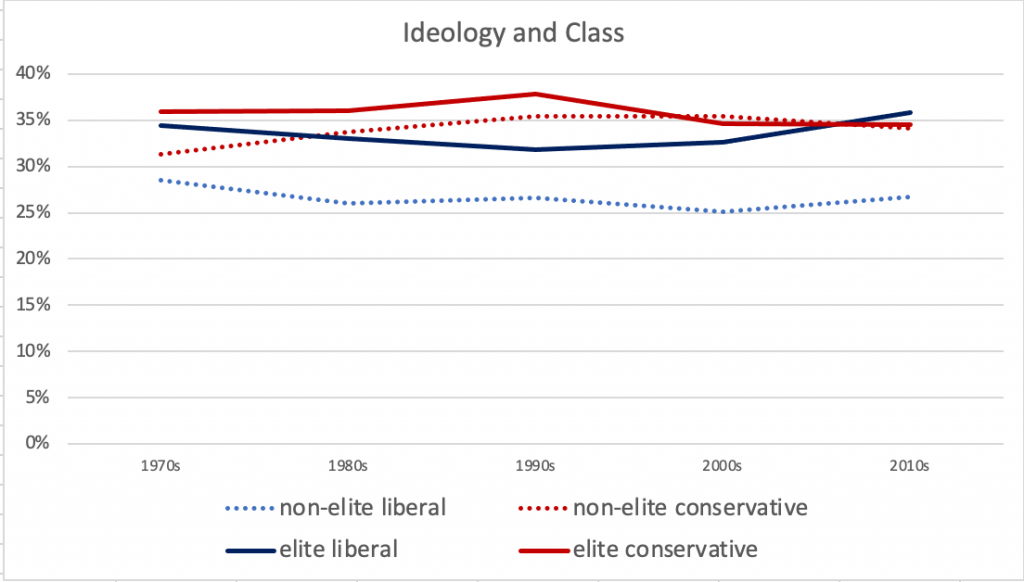
However, non-elites are considerably less Democratic, down from 56% to 45% between the 1970s and 2010s, with most of that change happening during the 1980s. This trend may reflect Southern realignment more than ideology. The graph below shows ideological trends for elites and non-elites. It is true that elites have become somewhat more liberal since 2000, but the changes are small. Overall, elites were more liberal than non-elites in the 1970s and still are today. (To be sure, what it means to be “liberal” has changed, but this is still a reason to doubt a story of ideological realignment.)
Work-week: The elite worked a mean of 41.5 hours in a typical week in the 2010s– essentially the same as the 41.2 hours their predecessors had worked in the 1970s. The non-elite are down about two hours/week to 37.4 hours.

Geography: The elite have not diverged from the non-elite in geographic mobility. Both groups have become about 3-4 percentage points less likely to live in the same city where they lived when they were 16 years old. In each decade, the elites have lived in places with larger average populations than the non-elites, but community size has shrunk for both groups–presumably, as a result of movement to the suburbs and exurbs.

Marriage: Most non-elite adults (72%) were married in the 1970s. That proportion fell to just over half (54%) by the 2010s. Most of this large shift was to the “never married” category. Elites were less likely than non-elites to be married in the 1970s, and even less so in the late 1900s, dropping to 35% married by the 1990s. However, the marriage rates among the elite has risen to 46% in the 2010s, approaching the rate of the non-elites. A consistent one in four elites reports never being married in each decade.

Religion: In each decade, elites have attended religious services a bit more often than non-elites (on average), but religious attendance has fallen for both groups.

Sources: General Social Survey; Tom W. Smith & Jaesok Son, “Measuring Occupational Prestige on the 2012 General Social Survey,” NORC at the University of Chicago GSS Methodological Report No. 122, 2014. See also: why the white working class must organize; the Left between Obama and Hillary Clinton.
legislative capacity is not zero-sum

One way to think about the power of any legislature is the decisions it can make–for instance, to raise or lower taxes or to ban or legalize various things. Its power is almost always limited by other institutions, such as an executive or courts. And its power is finite, which means that the distribution of power within the body is zero-sum. If one party bloc makes a decision, the other parties do not. If the speaker, prime minister, or legislative leader gains influence, the rank-and-file loses power. If the committees are powerful, the whole body is weaker.

Given this model, it is puzzling why power sometimes centralizes within a legislature (as it has in the Massachusetts State House). Since each member has an equal vote, why would most members vote for leaders and rules that empower the leaders as opposed to the rank-and-file?

Perhaps the members of a large body face a classic coordination problem: they don’t really like the distribution of power but cannot organize themselves to challenge it. Perhaps they would rather have a strong leader than be walked over by the executive branch. Perhaps the party leadership obtains loyalty by influencing election outcomes. Or perhaps the average member is simply content without a lot of influence. There could be a vicious cycle, in which the kind of person who wants to influence legislation gets frustrated and leaves, and the remainder vote to empower the leadership.

The other way to think about this issue is in terms of capacity rather than power. A legislature does many things. It collects input from stakeholders, investigates the other branches of government and public problems, considers policy proposals, assimilates research, develops proposals, builds consensus within and beyond the body, amends and refines bills, and (finally) makes decisions by voting.

It can do more or less of this. At a minimum, it may barely scrape by, passing the laws that are constitutionally required, such as a budget (or may even fail to accomplish that). At the maximum, it can operate like the US Congress in 1965, which wrote, refined, and passed landmark bills to create Medicare and Medicaid (plus the NEH and NEA), enfranchise people of color, involve the federal government in K-12 and higher education, and open the US to mass immigration. Whether you like those laws or not, they represented much more lawmaking than usual. In fact, the year 1965 perhaps saw more federal lawmaking than has occurred during my entire lifetime, and I was born in 1967.

Power (in the sense of the first paragraph) is zero-sum. But capacity is not. Just because one group of legislators is working away on school reform does not mean that a different committee can’t be holding hearings on taxes.

Total legislative capacity can be expanded. That requires attracting talented and dedicated legislators. It may require a favorable climate beyond the legislature. It also requires nuts-and-bolts support. For example, legislators have more capacity if they have more staff, both in their own offices and shared by the body. In the Massachusetts legislature, the typical House member has one employee, which is not enough to do much legislative business.

Less capacity in the legislature can mean more power for the other branches, particularly the executive. That is a finding of Bolton & Thrower, “Legislative Capacity and Executive Unilateralism,” American Journal of Political Science, 60(3), (2016), pp. 649-663. However, it is also possible for an entire government to lose capacity.

Newt Gingrich cut congressional staff in Washington, especially the staff of the nonpartisan legislative-branch bureaus, which employ fewer than one third as many people as they did before 1990. This made sense for what he wanted to accomplish. If total capacity is smaller, it is easier for the leadership to control the body. (In that way, zero-sum power is related to capacity.) Besides, Gingrich’s legislative agenda was very simple–tax cuts, above all–and it didn’t require nearly as much capacity as center-left legislation would. Still, the result was a national legislature that cannot do much legislating of any kind.

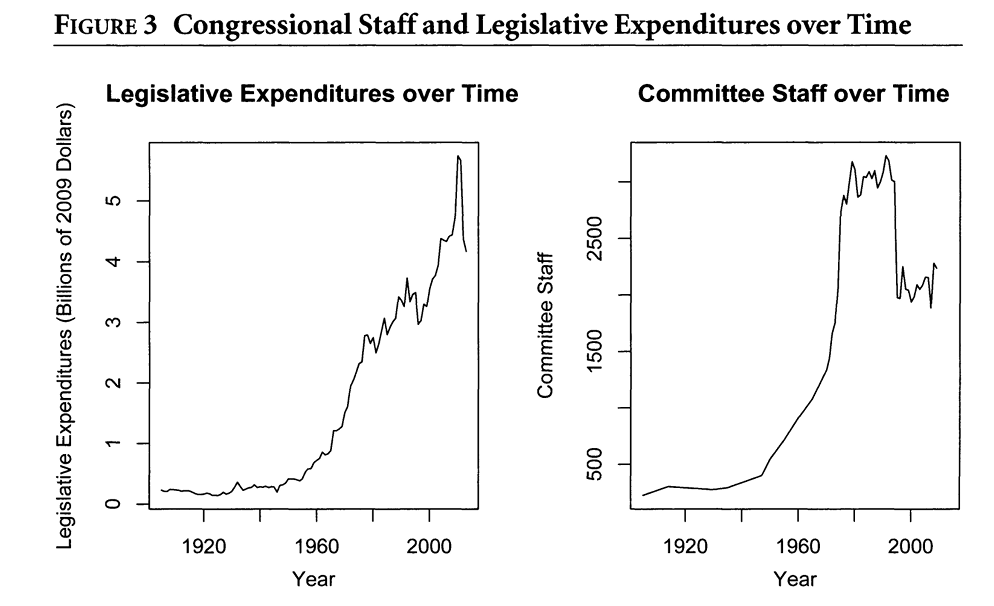
There is an interesting wrinkle in the two graphs below, taken from Bolton & Thrower 2016. Congress was at its most active and ambitious while its staffing was rapidly rising, but not yet at its peak. The peak lagged a decade or so behind. That fits my general impression that the modern welfare state proved challenging to manage and sometimes overburdened our institutions–meaning all three branches of the federal government, states and localities, interest groups, and the press. After Congress enacted the major elements of the Great Society, it turned to managing those programs and gave that task serious attention for about fifteen years. Then conservatives tried to cut the programs (consistent with their principles and their mandate) but also cut the capacity to manage them without actually abolishing them. The result has been successively worse implementation.

From Bolton, A., & Thrower, S. (2016). Legislative Capacity and Executive Unilateralism. American Journal of Political Science, 60(3), 649-663.

Today’s Select Committee on the Modernization of Congress recognizes the problem. They call for increasing the capacity of Congress, “increas[ing] the funds allocated to each Member office for staff,” raising staff pay, and hiring “bipartisan [committee[ staff approved by both the Chair and Ranking Member to promote strong institutional knowledge [and] evidence-based policy making.”

This is an important agenda, and we need similar changes in Massachusetts.

See also: an agenda for political reform in Massachusetts; a different explanation of dispiriting political news coverage and debate; civic renewal in a state legislature; etc.

“you should be the pupil of everyone all the time”

One should accept the advice of those who are able to direct others, who offer unsolicited aid. One should be the pupil of everyone all the time.

– Shantideva, The Bodhicaryavatara 5:74, translated by Kate Crosby and Andrew Skilton (ca. 700 CE)

The fifth book of this major work is devoted to “The Guarding of Awareness.” Here Shantideva offers many precepts, of which this is just one. For instance, in the previous verse, he recommends moving quietly: like a crane, a cat, or a thief.

No one could fully follow all these instructions all the time. That is a problem of which Shantideva is fully aware. Chapter 4, “Vigilance Regarding the Awakening Mind,” addresses the inevitable backsliding that comes after an oath to attain Buddhahood. “Swinging back and forth like this in a cyclic existence, now under the sway of errors, now under the sway of the Awakening Mind, it takes a long time to gain ground” (4:11). The best we can do is try. “If I make no effort today I shall sink to lower and lower levels (4:12).

Therefore, the question is not whether it is possible to be the pupil of everyone all the time (it is not), but whether that is a valid aspiration. It isn’t obviously so. After all, many people communicate false and even wicked ideas. Why listen to them? We are also very repetitious. I offer virtually nothing that hasn’t already been said better by others. Why should everyone be my pupil; and I, theirs? And if we are always listening to everyone, when are we acting to improve the world?

The first quoted sentence recommends taking advice from “those who are able to direct others”–presumably those who have something valuable to offer. It doesn’t imply the striking second sentence, which tells us always to be learning from everyone. Why?

Maybe it is hyperbole: an exaggerated reminder to be more open to other people (and other animals) than we would otherwise tend to be, but not a rule that the wise would apply literally.

Or maybe it connects to Shantideva’s core recommendation: compassion for all. The argument would go: Each of us knows the most about our own situation and context. We each have a world of our own, which is a portion of the whole world viewed from our particular spot. The best life is a life of compassion for all those individuals. To be compassionate toward them requires understanding their situation as much as possible. And that implies being their pupil, all of the time.

Is this right? How does it relate to the virtue of justice? And what should we think about scientific methods of discernment? For instance, is surveying a representative sample of Americans a way of being a pupil of them all? If not, why not?

See also: how to think about other people’s interests: Rawls, Buddhism, and empathy; “Empathy” is a new word. Do we need it?; Empathy and Justice; etc.

how people estimate their own life expectancies

How long people expect to live could be important for at least two reasons.

First, individuals may know information about their own circumstances that affect their predictions. Maybe they know that they are sick or in frequent danger from gun violence. In that case, their prediction of their own life-expectancy might be a proxy for their social circumstances.

Second, their prediction may change some of their own cost/benefit calculations. There is, for example, no economic or other extrinsic reason to pursue education if you fear that your life is nearly over. Then again, you might procrastinate on getting more education if you think you have a very long time left to live.

Therefore I am interested in who makes optimistic or pessimistic estimates of their own life-expectancies. Of course, younger people will expect to live for more years, on average, than older people, and that doesn’t reflect optimism. So I adjusted for age by looking at the difference between how long people expect to live and how long the Social Security Administration (SSA) predicts that someone of their age and gender will live. If people give a higher number than the SSA, they are optimistic; a lower number reflects pessimism. Pessimism may be entirely warranted and reasonable, but it could still have negative effects on some important behaviors.

Data: Tufts Equity Research Group. Analysis: Peter Levine

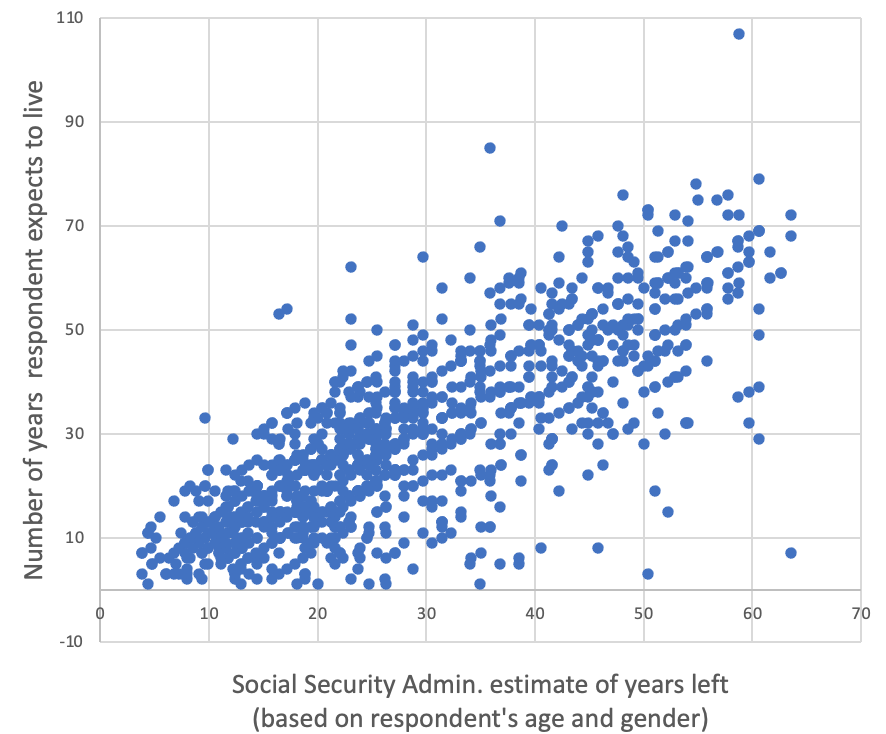
The scatterplot shows that individuals’ predictions correlate with what the SSA would say, but there is a lot of variation. One young dude expects to live for another 110 years, whereas the SSA would give him 58 years. Several people expect to die very soon. What accounts for these differences?

Using the Tufts equity research survey, I looked first at the factors that are incorporated in prominent actuarial models–the things that we’re told actually lengthen or shorten our lives. If you go to a “longevity calculator” like this one, it will ask you to enter your own year of birth, gender, race, education level, body mass index, income, whether you are retired, and your habits of exercise, smoking, and drinking alcohol. It will tell you how many years you probably have left to live, based on your answers and a significant body of research.

Some of those factors affect optimism, but some do not. Reporting results from a regression model that are significant at p<.05:

  • Younger people are more optimistic, meaning not that they expect to live more years than older people but that their predictions for their lives are higher in comparison to the SSA’s predictions for them.
  • White people are more optimistic than people of color, and they have a basis for that.
  • Higher body mass index (BMI) correlates with pessimism.
  • Regular vigorous exercise predicts more optimism.
  • Education, gender, marital status, income, employment status, and drinking and smoking are not related to optimism, even though they are significant predictors of life expectancy in actuarial models.

I also went looking for measures that might predict optimism even though they are not in the actuarial models that I see online. Some of them are quite significant. When added to a regression model with the variables listed above …

  • Frequency of attending religious services predicts optimism.
  • People with better overall health (per their self-report) are much more optimistic.
  • Stress about climate change comes close to predicting pessimism (p=.054).
  • Whether you own a gun and whether you planned to vote for Trump or Biden are not related to optimism.

To some extent, people seem to be making accurate predictions based on life circumstances. For instance, they are right to worry about high BMIs. They seem to be missing some important factors, such as smoking and drinking. The correlation with religious participation could reflect the beneficial results of participating in communities, or perhaps religion makes one optimistic about one’s own life, or perhaps people who think they have a long time to live are motivated to attend services.

See also: how predictable is the rest of your life?; the aspiration curve from youth to old age

how predictable is the rest of your life?

Last year, I had a chance to add this question to the Tufts national survey of equity:

Imagine that someone summarized your life, long after your lifetime. To what extent do you already know what that summary would say?

I was interested in how people’s life circumstances might lead them to answer that question differently, and what different answers might mean. For instance, you might be a successful young student for whom the unpredictability of the rest of your life is a sign of broad options and unlimited possibility. You might hate your current situation and feel depressed because you don’t believe it will ever change. You might feel precarious, so that your uncertainty about the remainder of your life is mostly stressful.

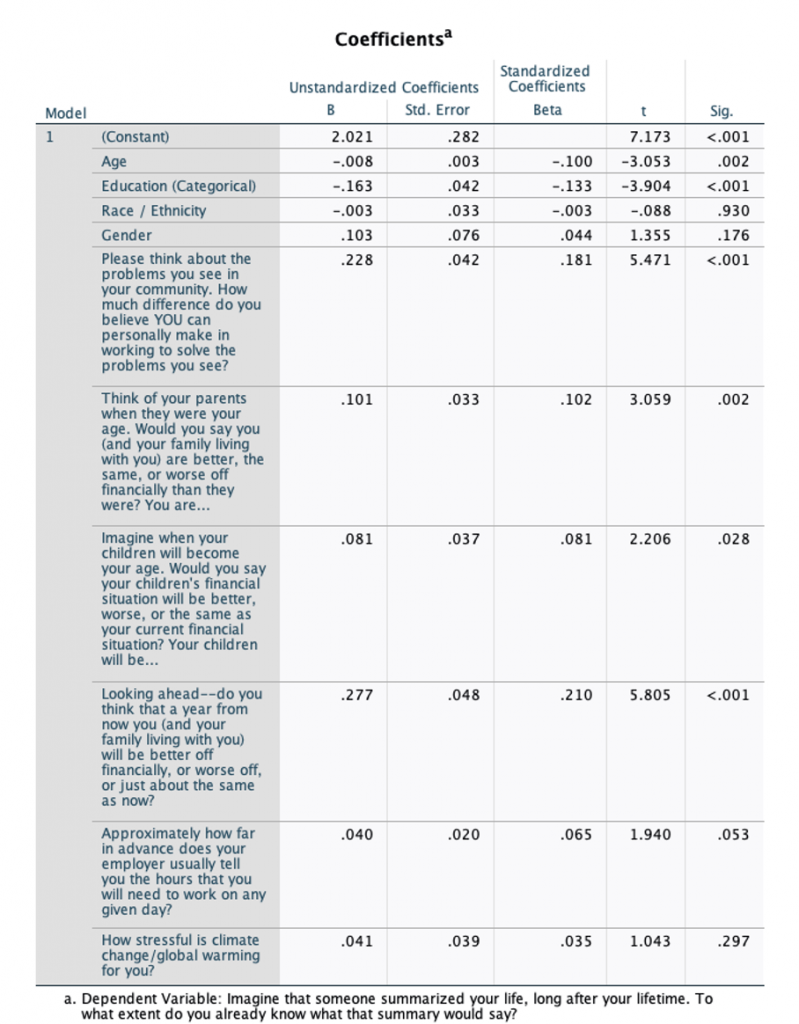
I hope to investigate how various subgroups answer the question. In the meantime, I ran a very simple regression to try to predict answers based on people’s demographics (age, race, gender), their perception of their own economic trajectory (Are you better of than your parents, will you be better off next year, and will your children be better of than you?), their sense of civic or political efficacy (Can you make a change in your community by working with others?), a measure of stability at work (How far in advance do you know how many hours you will be working per day?), and a measure of stress about climate change (to see whether worries about the climate were making some people uncertain about their lives).

The results are below. (A positive coefficient indicates less certainty.) I’ll summarize the results that are statistically significant (p<.005):

  • Certainty about the story of one’s whole life rises with age, but the coefficient is small. People tend to get just a tiny bit more certain with each passing year. I am more interested in the small relationship than its statistical significance.
  • Certainty rises with more education. At least if you put the whole sample together, it seems that people who have more education don’t feel greater uncertainty because their options are expanded. Rather, they feel more certain, perhaps because they are more secure or feel more control over their lives.
  • Certainty falls with civic efficacy. Apparently, if you think you can make a difference in the world around you, you are less confident that you know the whole story of your life. I hope this is because you believe that unexpected good options might open up.
  • Certainty is lower for people who see their own families on a positive economic trajectory. Maybe perceiving that you are getting wealthier makes you hope for unexpected futures. I find it interesting that economic optimism and education have the opposite relationship to this outcome.
  • The demographic measures, stability at work, and climate stress are not related to this outcome.

As always, I would welcome any thoughts about these very preliminary findings.

See also: youth, midlife & old-age as states of mind; Kieran Setiya on midlife: reviving philosophy as a way of life; to what extent do you already know the story of your life?; the aspiration curve from youth to old age