There is much writing–from a variety of ideological perspectives–about a new elite that is said to dominate culture, politics, and the economy. This group obviously bears a resemblance to previous elites (and disproportionately descends from parents who were wealthy and powerful), but perhaps it demonstrates some new features.
Among the novel characteristics could be: high education and technical skills (as opposed to deriving wealth from physical property), a meritocratic ideology, competitiveness and addiction to work, a tendency to cluster together in specific neighborhoods of selected cities and to marry only people of the same group, and a tilt toward center-left parties, which are said to be losing their working-class base in reaction to the dominance of meritocratic elites.
For instance, David Brooks writes:
The class structure of Western society has gotten scrambled over the past few decades. It used to be straightforward: You had the rich, who joined country clubs and voted Republican; the working class, who toiled in the factories and voted Democratic; and, in between, the mass suburban middle class. … But somehow when the class conflict came, in 2015 and 2016, it didn’t look anything like that. Suddenly, conservative parties across the West—the former champions of the landed aristocracy—portrayed themselves as the warriors for the working class. And left-wing parties—once vehicles for proletarian revolt—were attacked as captives of the super-educated urban elite. These days, your education level and political values are as important in defining your class status as your income is.
I found this story perfectly plausible but wanted to examine it empirically. Therefore, I explored it using data from the General Social Survey (GSS). In brief, I do not see evidence that today’s elite have different ideological or partisan leanings from their predecessors nearly fifty years ago, nor have they diverged from non-elites in terms of work hours, religion, or geographical mobility. They are more educated and more racially diverse than elites were in the 1970s, but overall, they look very much like their predecessors. That means that we are not experiencing a scrambling or a situation that has “suddenly” developed. Rather, critiques of a liberal-leaning, highly educated elite have been pretty consistent since the days of Richard Nixon, Spiro Agnew, George Wallace, and Pat Buchanan.
Method: The GSS categorizes jobs by prestige, based on a survey of representative Americans. In 2012, respondents rated a street corner drug dealer and a panhandler lowest (at 1.9 and 2.1, respectively) and a college or university president and a physics professor highest (at 7.1 and 7.2). [Correction: physicians are highest, at 7.6] A lawyer was rated 6.4; a mechanical engineer, 6.6; and a board member of a large company, 6.8 (Smith & Son 2014).
I isolated people who either held jobs in the top tenth of the prestige scale or else were married to people in the top tenth. Although it matters whether one is the worker or the spouse, I was interested in high-status households and wanted to include partners, especially in the 1970s.
I could have defined the “elite” in different ways. Trying various definitions would be valuable. However, it is important not to select on the dependent variable. In this case, one could define the elite as people who are liberal, live in major metro areas, hold advanced degrees, and meet other criteria assumed by commentators like Brooks. But then the conclusion would be foreordained. With equal validity, one could identify survey respondents who are conservative, religious, and powerful and tell a story about them. To avoid this form of bias, I pre-selected a definition of “elite” and then examined this group empirically. To be honest, I was surprised by how little change I observed.
Here are some comparisons and contrasts between the most-prestigious households in the 1970s and the 2010s.
Education: Today’s elite (as defined above) is more educated. Seventy-two percent hold at least a bachelor’s degree, up from 58% in the 1970s. Less than one percent don’t have a high school diploma, down from 6% in the 1970s. The non-elite also have more education than they did in the 1970s; however, just 24% hold a bachelor’s degree or more.
At the same time, a graduate degree certainly does not guarantee admission to the elite. Sixty-four percent of people with graduate degrees are not in the top tenth by occupational prestige.
Demographics: The elite was 93% white in 1970, six points whiter than the non-elite at the time. Both groups are now more diverse, but the change has been faster among the elite (who started at a very white baseline). In the 2010s, 80% of the elite was white, 8% was African America, and 12% belonged to other racial groups.
Party and ideology: Elites have not moved toward the Democrats. Including independents who lean toward either party, the elite has gone from 47% Democrat and 39% Republican in the 1970s to 47% Democrat and 37% Republican in the 2010s. They already leaned Democratic in the days of Richard Nixon, and still do by an almost identical margin.
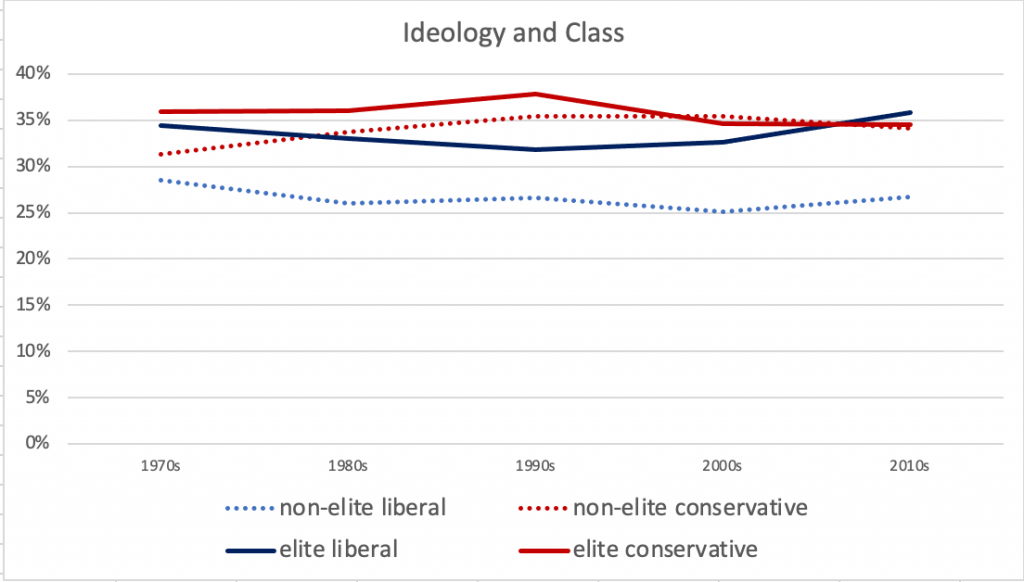
However, non-elites are considerably less Democratic, down from 56% to 45% between the 1970s and 2010s, with most of that change happening during the 1980s. This trend may reflect Southern realignment more than ideology. The graph below shows ideological trends for elites and non-elites. It is true that elites have become somewhat more liberal since 2000, but the changes are small. Overall, elites were more liberal than non-elites in the 1970s and still are today. (To be sure, what it means to be “liberal” has changed, but this is still a reason to doubt a story of ideological realignment.)
Work-week: The elite worked a mean of 41.5 hours in a typical week in the 2010s– essentially the same as the 41.2 hours their predecessors had worked in the 1970s. The non-elite are down about two hours/week to 37.4 hours.
Geography: The elite have not diverged from the non-elite in geographic mobility. Both groups have become about 3-4 percentage points less likely to live in the same city where they lived when they were 16 years old. In each decade, the elites have lived in places with larger average populations than the non-elites, but community size has shrunk for both groups–presumably, as a result of movement to the suburbs and exurbs.
Marriage: Most non-elite adults (72%) were married in the 1970s. That proportion fell to just over half (54%) by the 2010s. Most of this large shift was to the “never married” category. Elites were less likely than non-elites to be married in the 1970s, and even less so in the late 1900s, dropping to 35% married by the 1990s. However, the marriage rates among the elite has risen to 46% in the 2010s, approaching the rate of the non-elites. A consistent one in four elites reports never being married in each decade.
Religion: In each decade, elites have attended religious services a bit more often than non-elites (on average), but religious attendance has fallen for both groups.
Sources: General Social Survey; Tom W. Smith & Jaesok Son, “Measuring Occupational Prestige on the 2012 General Social Survey,” NORC at the University of Chicago GSS Methodological Report No. 122, 2014. See also: why the white working class must organize; the Left between Obama and Hillary Clinton.