I am very happy to serve on this committee and would be open to questions about it:
The Scholars at Risk (SAR) Program at Tufts is dedicated to helping scholars, artists, writers, and public intellectuals from around the world escape persecution and continue their work by providing ten-month-long academic fellowships at Tufts University. Tufts has been a member of the international Scholars at Risk (SAR) network, which is chaired by Tufts Trustee Lisa Anderson, since 2011. Tufts has hosted several scholars in the past in both Medford and Boston. These scholars have made positive contributions to our academic life and offered important perspectives to our students and faculty.
Details are here. There may also be opportunities to conduct funded research or to teach from Ukraine (or from other countries in crisis) without coming to Tufts, but that is still being considered.
Why have some states seen many more deaths from COVID-19 than others? Do differences in state policies matter? Is it mostly about demographics? Or what about factors like climate and population density, which could influence whether and when people congregate indoors?
To explore these questions, I made a spreadsheet with 58 salient variables about the 50 states, drawing most of the data from the Senate Joint Economic Committee or the Kaiser Family Foundation. I then went fishing for variables that could predict cumulative death rates from COVID-19. I use this “fishing” metaphor with irony, because there is a danger of obtaining spurious results when you explore too many variables at once. Still, the following results might suggest tighter research questions.
Below, I describe nine regression (OLS) models, each with a different thematic focus, arranged in order by how much variance in the states’ COVID-19 mortality they seem to explain. (I report adjusted r-square statistics, which should allow the models to be compared despite differences in the number of variables.)
In summary: the states’ policies that I measured and the partisanship of governors did not matter, but the proportion of people who voted for Trump did. That relationship was not explained by demographics, which I controlled for.
Variables that mattered in many of my models included the percentage of the population that was already in poor health, the GOP vote share in 2020, Black/White residential segregation, and the GINI coefficient (a measure of inequality). A model with just those four components could explain 71% of the variance in COVID deaths (unadjusted r-square = .715).
A politics and policy model. Variables: party of state governor, percent of the 2020 state’s popular vote for Republicans, whether the state required masks indoors for some people in Feb 2022, whether the state required, allowed, or banned local vaccine requirements, and state/local spending per capita. The only statistically significant correlate of the mortality rate: the GOP vote share in 2020. Adjusted r-square = .203, meaning that this model offers little insight.
A geography model. Variables: population density, percentage rural, average commuting time, mean daily temperature. Statistically significant correlates: none. Adjusted r-square = .240 (again, a poor fit).
Sociability model: Variables: average number of close friends, percent of neighbors who regularly do favors, number of nonprofits per 1,000 people, percentage who worked with neighbors to fix/improve something. Statistically significant correlate: working with neighbors (related to lower mortality). Adjusted r-square = .415.
A comorbidities model: Variables (all measured pre-pandemic): percent in poor health, premature mortality rate, mortality from suicide/drug overdose, percent disabled, percent with diabetes, obese, and smokers. Statistically significant correlates: general poor health and disabilities. Adjusted r-square = .451.
A political participation model: Variables: percent who participated in a demonstration, attended a public meeting, served on a committee, and voted in 2012 and 2016. Statistically significant correlate: attending a public meeting (related to lower mortality). Adjusted r-square = .483.
An economics model. Variables: unemployment, incarceration, poverty, GINI coefficient, college graduation rate, internet access at home. Statistically significant correlates: worse inequality, higher incarceration, fewer people with BAs. Adjusted r-square = .623.
A politics and demographics model. Variables: the party of state governor, percent of the 2020 state vote for Trump, and the racial demographics and median age of the state. Statistically significant correlates: higher GOP vote, more African Americans, more Latinos, a higher median age. Adjusted r-square = .647.
A model that explains most of the variance. Variables: percent in poor health before the pandemic, GOP vote share, Black/White segregation, GINI coefficient, percent over age 65, incarceration rate, college graduation rate. Statistically significant correlates: the first three. Adjusted r-square = .699. (Unadjusted r-square = .735.)
My dataset also included some variables that I have not mentioned here, including several measures of trust (for other people and for institutions) and other types of civic and political participation. None seemed to be influential in any of the models I tried.
The left should represent the lower-income half of the population; the right should represent the top half. When that happens, the left will generally advocate government spending and regulation. Such policies may or may not be wise, but they can be changed if they fail and prove unpopular. Meanwhile, the right will advocate less government, which (again) may or may not be desirable but will not destroy the constitutional order. After all, limited government is a self-limiting political objective.
When the class-distribution turns upside down, the left will no longer advocate impressive social reforms, because its base will be privileged. And the right will no longer favor limited government, because tax cuts don’t help the poor much. The right will instead embrace government activism in the interests of traditional national, racial or religious hierarchies. The left will frustrate change, while the right–now eager to use the government for its objectives–will become genuinely dangerous.
This class inversion is evident in many wealthy democracies, although usually with exceptions and complexities. For instance, in the USA, Democrats now represent the 17 richest congressional districts and most of the richest 50. Put together, Democratic districts are wealthier than Republican ones, although Democratic candidates often win a bit more of the vote below $50,000/year than above that income level. It’s in this context that we now see Republicans eager to use state power against private companies on cultural issues.
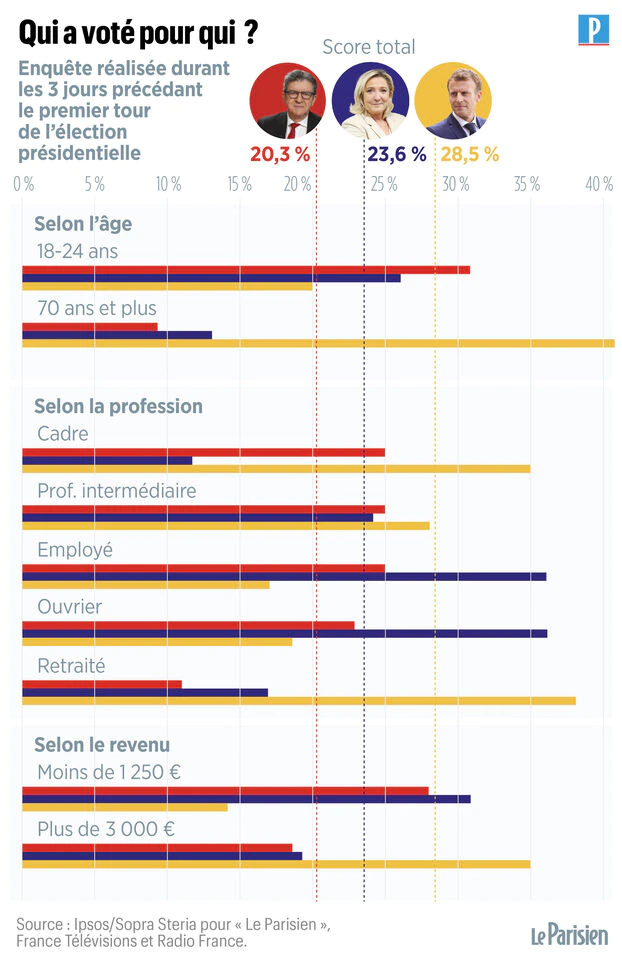
A similar inversion was evident in France this week. The class called “cadres” could be translated as executives, although I understand that it is a larger category than that English word implies. Among the cadres, Macron (a centrist technocrat) won and Melenchon* (from the left) came in second, with Le Pen (right-wing) drawing only about 12%.
The “intermediate professions” split their votes about evenly. This is a large and diverse group (26% of all employees), ranging from teachers to technicians. I would guess that sub-groups within this 26% voted quite differently from each other.
At the bottom of the scale–the ordinary employees and workers–Le Pen won by pretty substantial margins. Melenchon edged out Macron among these two categories, but he ran far behind Le Pen. If we look instead at wages, Macron performed better at the higher end, while Le Pen and Melenchon split the lower end about evenly. Macron won the most retirees and came in third amongst the young.
In the first round, French voters had numerous choices, and three candidates finished pretty close to even. That makes the outcome somewhat difficult to compare to a two-party contest between left and right, as in the USA. But one could envision Biden as a kind of hybrid of Macron and Melenchon (we can debate which one he is closer to), and Le Pen as Trump. Then the class inversion is clear.
This pattern is by no means exclusive to France, but it presents dangers wherever it appears.
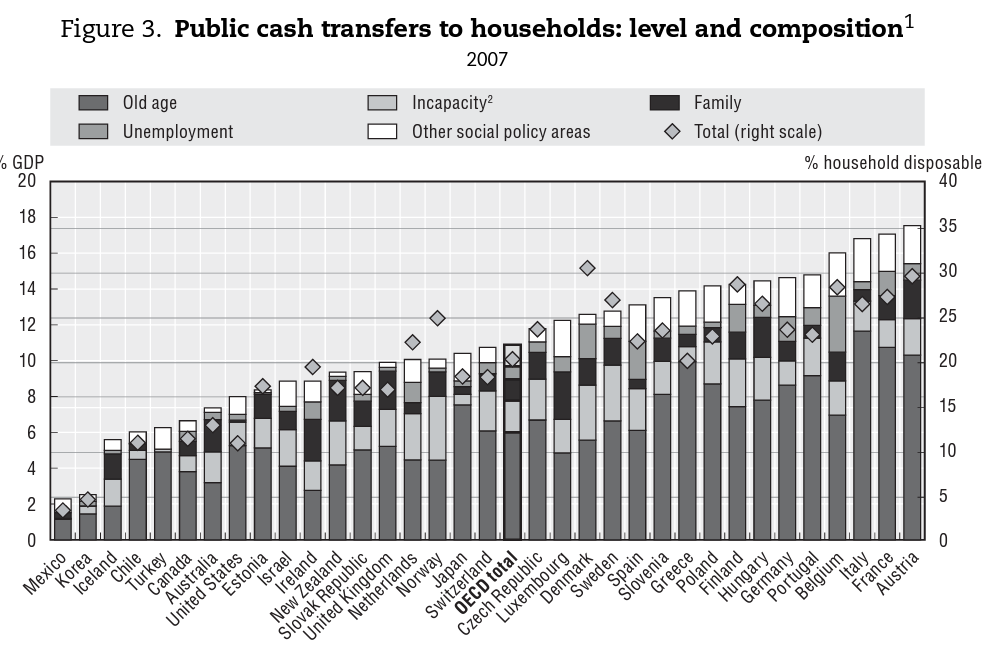
I do perceive France as combining relatively egalitarian economic policies with a particularly sharp gradient of prestige and power. As the figure below shows, France uses taxation and spending to transfer far more cash than the US does (albeit mostly to pensioners), yet an extraordinary proportion of French business, cultural, and political elites attend a few Parisian schools. This means that a welfare state that redistributes a great deal from rich to poor has a culturally elite look. That may be a refined version of an international problem.
I am seeking a congregation (of any religion, denomination, tradition, size, and location) for a research study. My interest is in testing a new method that I have been developing with colleagues that could apply to any community. I would give the congregation’s leadership–or its full membership–easy-to-understand findings about shared values and areas of disagreement within their congregation that should have practical value for planning events and programs.
Please consider whether this project might interest a congregation to which you belong or one that you know. Inquiries are welcome. More details follow:
I would ask the clergy or other leader(s) of the congregation to encourage members to take anonymous online surveys. The minimum would be two: a short survey with open-ended responses followed by a multiple-choice survey a week or two later that is based on the first one. I would be interested in repeating the multiple-choice survey months later to understand change, although that’s optional. If it’s practical, I would also like to visit and observe informally to get a feel for the community.
I would publish a scholarly study that would refer to the congregation anonymously (e.g., “a Protestant church in the Northeastern USA”). I would also provide the congregation with concise findings in PowerPoint format and would be happy to discuss them. No money would change hands. The congregation would own the PowerPoint and would not be obliged to publish or share it in any way. No individuals would be obligated to take the surveys, and I would expect only some people to do so. No identifiable information about individuals would be shared either within or beyond the congregation.
I could provide more detail about the method, but in brief, we don’t simply ask people their opinions about values, beliefs, and norms. Instead, we ask them how their personal opinions relate to each other. For instance, do they value A because they value B? Do they think that A causes B? From those responses, we generate network diagrams of the beliefs of each respondent and of the community as a whole. In this study, the questions would focus on religion and the congregation as a community, not on politics (unless respondents happen to bring up political matters).
Typically, each person’s responses are unique—a nice illustration of the uniqueness of human beings and how much we lose when we assign people to categories. Yet we typically see clusters of agreement and disagreement that can otherwise be overlooked. Understanding these patterns should provide ideas for visitors, readings, events, discussion groups (etc.) that would be valuable for the specific congregation.
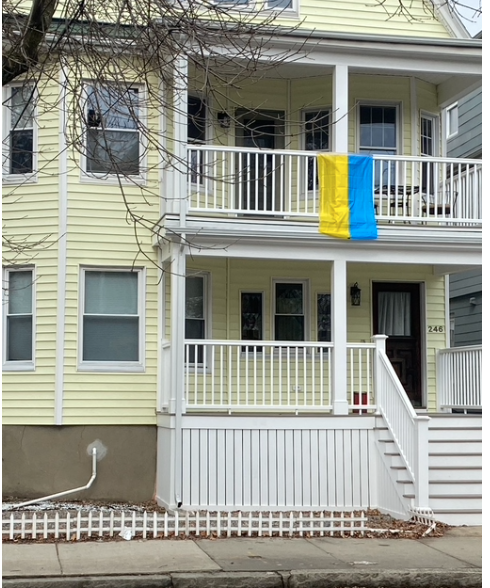
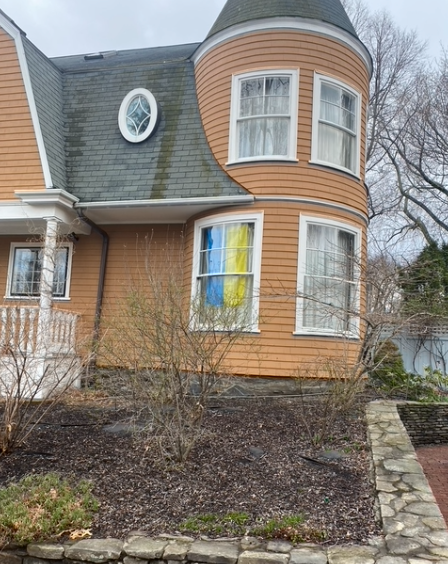
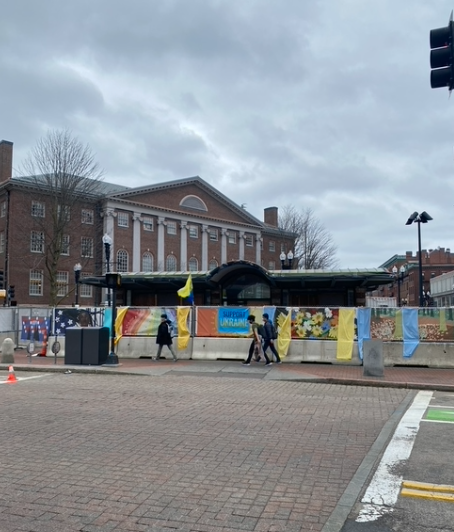
On a classic double-decker houseA fancier houseAnother oneInside a storeA public squareFlying over John HarvardPublic statue wrapped to honor Lviv (by www.rossmiller.com/)Dorm room windowsOK, maybe a coincidence