According to the AP exit polls, “About 4 in 10 U.S. voters nationally say the economy is the most important issue facing the country, as most express concern about gas prices and the cost of groceries.”
This finding does not mean that economic circumstances determined the outcome. For one thing, six in ten respondents had other top priorities. And even for those who picked the economy as the single most important issue, other issues may have influenced their decisions.
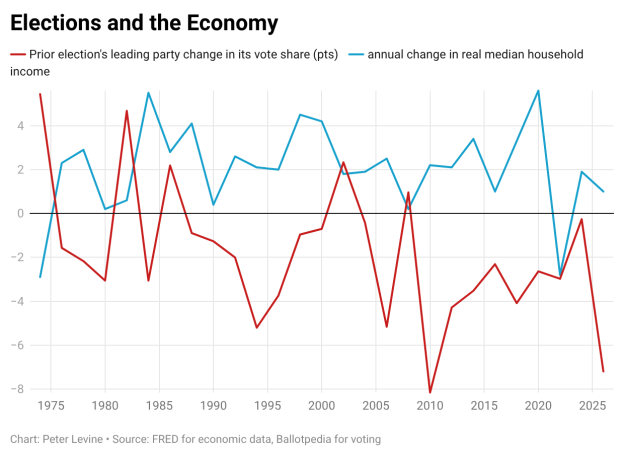
But more importantly, the claim that economic performance explains this election–or US elections, in general–is tenuous. The economic statistic that is generally found to correlate best with electoral outcomes is the change in real median household income (i.e., income adjusted for inflation). In the graph that accompanies this post, I show that statistic for election years, along with the change in the vote share of the party that had won the election two years before.
As you would expect, the two lines correlate negatively–lower growth in real income goes along with worse performance for the party that had won the last time. But the correlation is not very high, at -0.33. I also tried some other economic statistics, such as the change in real disposable income one quarter before each election and the change in median household income, but the correlations were even weaker.
It was 1992 when James Carville said, “It’s the economy, stupid.” Indeed, economic discontent probably helped his boss, Bill Clinton, win the White House that year. But the graph shows that real disposable income rose in 1992, yet the incumbent Republican lost the White House and the Democrats lost vote share and nine seats in the House.*
Furthermore, the 2026 election has reduced the correlation between economics and electoral outcomes. I had to use projected or predicted statistics for 2026. I guessed that the annual change in median income, adjusted for inflation, will be +1 percent for this year as a whole. And I guessed that Democrats will take 56% of the national vote when all the ballots are counted. The graph shows that the collapse in Republicans’ vote far exceeds what one would expect from the modest change in real income.
I know that people dislike paying $4/gallon for gasoline. Inflation may also support a broader verdict of broken promises, corruption, and incompetence. But $4/gallon gasoline does not explain one of the biggest swings in electoral support in a half century.**
I want to counter a relatively cynical interpretation–that Americans would have supported a would-be authoritarian president, except that prices happened to rise on his watch. I really don’t think they like this president or what he stands for.
*I acknowledge that a lot of the economic growth happened at the end of 1992, too late to save George H.W. Bush. However, in the second quarter, real disposable income had already risen by 2.8 points, which should have helped him.
**Many would say it’s the biggest swing since 1974. My graph makes it the second-biggest change, because I chose to compare each year to two years prior, not four years prior. There are arguments for either approach.