It is common advice-and wise–to specify your own assumptions about the world, find data to test them, and update as necessary.
Thus, as we move through the second year of the second Trump administration, it’s worth noticing what you assume about recent trends and then checking those assumptions.
You might think that Donald Trump has slashed federal spending and fired much of the federal civilian workforce, or you might assume that nothing much has changed in Washington.
Your actual views are probably more nuanced than either of these caricatures. In any case, here is some data. I have chosen to begin the trends in 1970, to limit our attention to the era after the Great Society had expanded the federal government.
First, federal civilian employment is down notably–by about 17%. There was a decline of a similar magnitude under Bill Clinton (“Reinventing Government”), but this one is a steeper and more chaotic. There was no decline at all in the number of civilian federal employees under Reagan, either Bush, or Trump I. On the other hand, the layoffs during Trump II follow considerable growth. The number of federal employees (other than postal workers) was the same this spring as it was in 2009, but it had grown in between. (I think the spikes in the graph represent people hired to conduct the decennial census.)
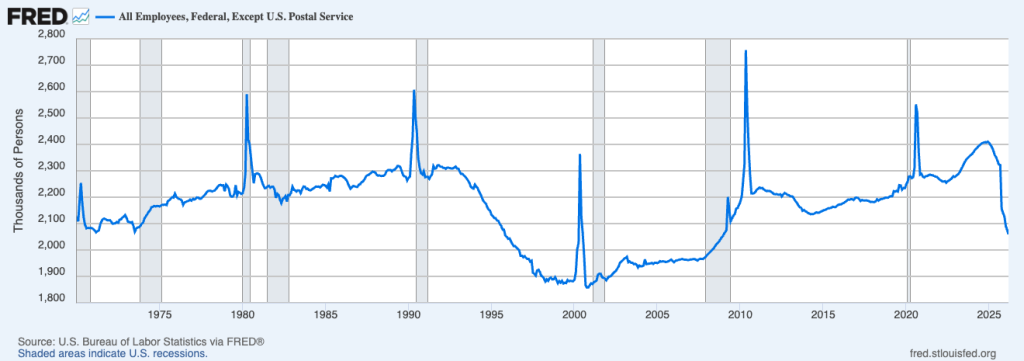
Staff cuts have been concentrated in certain programs. For example, USAID is gone, its staff of about 16,000 people almost entirely laid off. Such changes have substantial impact on policies, but not so much on total personnel. USAID formerly employed about 0.08% of the federal workforce. In short, Trump’s staff cuts are highly uneven.
Second, total federal spending is up:
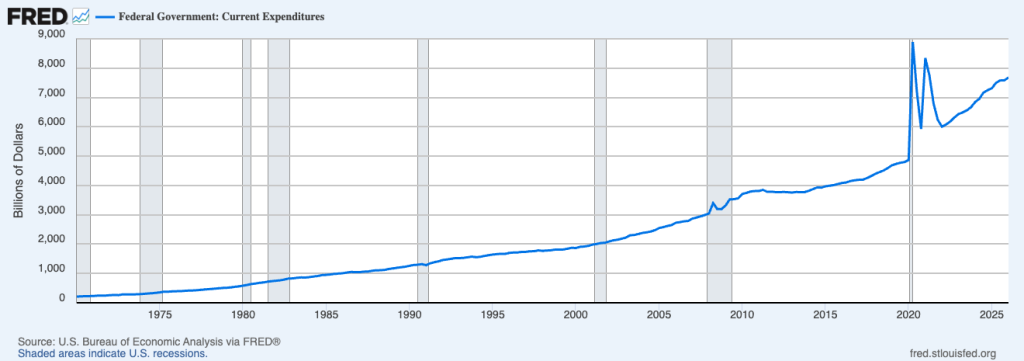
This graph is not adjusted for inflation. The spending increase in 2025 was 4.6%, and some of that growth was eaten up by 2.7% inflation. But real spending was up.
Much federal spending goes to defense or entitlement programs such as Social Security. Spending on domestic goods and services (excluding income transfers) fell by almost two percent in Trump’s first year.
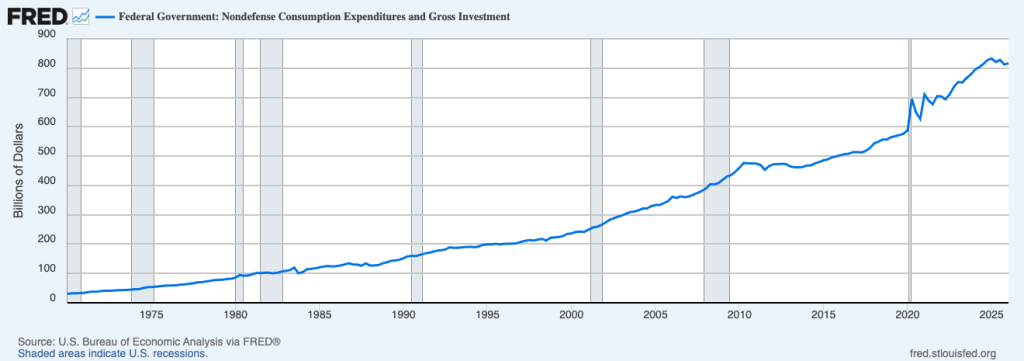
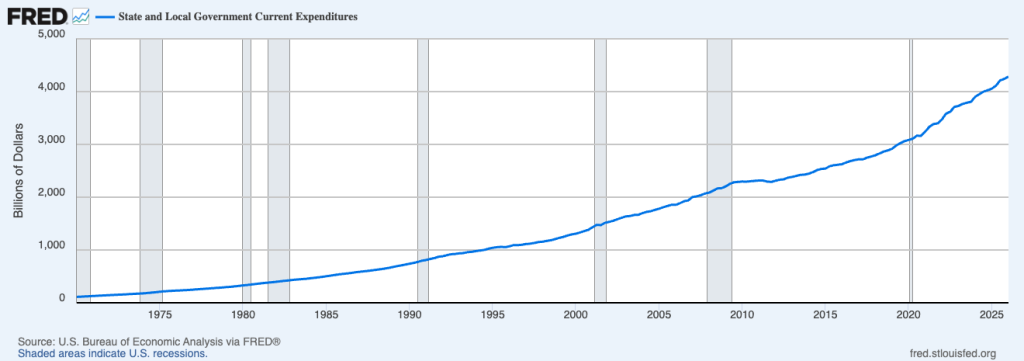
But federal transfer payments were up by 5 percent (not shown). Meanwhile, states and localities spent more:
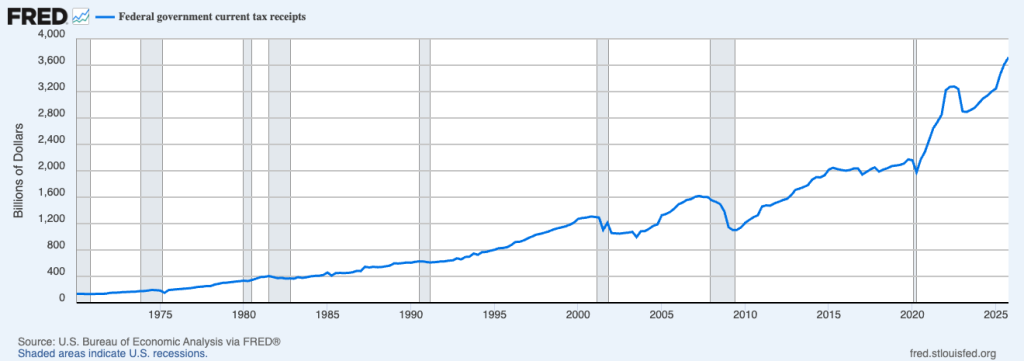
As of late 2025, federal tax receipts had risen substantially (by almost 16 percent compared to 2024). In the spirit of checking one’s prior assumptions, I should disclose that I had assumed that federal tax receipts had fallen.
My goal is not to make any overall point or judgment, but to focus our attention on major trends. For example, it will be crucial to reconstitute USAID, and, ideally, to make it better than it was. But the next president will not have to create a whole federal civil service, because total federal civilian workforce is about the same size as when Obama took office. Nor will the next president have much room to expand federal spending, since that actually rose under Trump.