I’m attending “Getting to 80%: A Symposium Advancing Voter Participation,” a discussion of the “moonshot” goal of raising US voter turnout to 80% (It’s at the Harvard Kennedy School.)
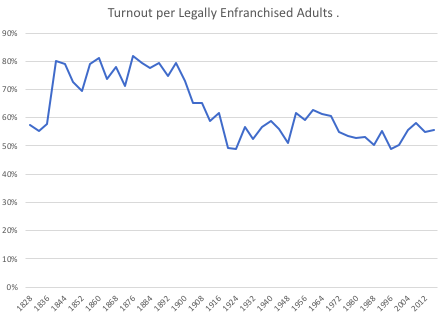
The historical context is not easy to find online, so here are two graphs that should be viewed together. The first graph, derived from sources like this, shows votes cast per people who were allowed to vote. In 1840, that meant white men (property restrictions having been dropped in most states by then); just above 80% of them voted. In 2012, that meant every citizen at least 18 years old, except for some people with felony convictions, and just under 60% voted. So the story is one of decline, mostly during the late 1800s and early 1900s. A common explanation is that powerful, identity-based, grassroots parties gave way to expert-driven government with weaker parties and less at stake in most elections. The question is how we can get back to 80% in a new political environment.
The other graph (from here) shows the proportion of the whole population that has cast popular votes for president. It shows dramatic improvement over time, with the expansion of the franchise, albeit with some stagnation in recent years. The question is how we can push the line higher to approach 80% for the first time.
