- Facebook45
- Twitter2
- Total 47
The National Assessment of Educational Progress (NAEP) periodically measures US students’ knowledge of civics with an instrument that looks like a test, although it has no stakes for the students or teachers. I have served on the design committee for that instrument for many years. I don’t love the framework, which is dominated by the formal structure of the federal government. However, the NAEP is a carefully constructed assessment with a large, representative sample, so the data are certainly worth using.
Because states adopt their own standards, course requirements, and other policies for civics, we would like to understand which state policies are most effective. In a recent paper, Steven Michael Carlo presents mean NAEP civics scores for each state for 2014-18. Importantly, he adjusts these scores for other factors that might affect the results, namely: individual students’ race/ethnicity and gender, whether their school is public or private, the party of the state’s governor and legislature, the state’s adult and student demographics, state per-pupil expenditures on k-12 schools, and the state’s percentage of private school students.*
Of course, one could add more variables of interest, including various state policies. However, Carlo has presented a plausible answer to the question: Which states do better at civics?
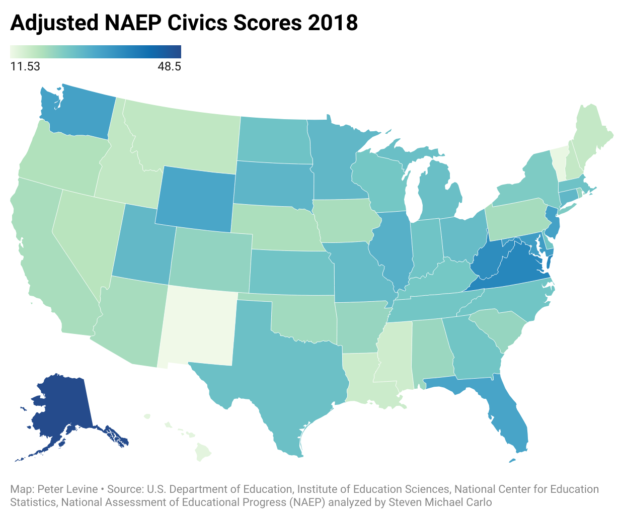
I thought it might be useful to display two columns of data from Carlo’s paper in the form of maps, because a visual display can help to suggest hypotheses. At a minimum, states like Louisiana, New Mexico, Mississippi, and Vermont that have low adjusted scores should investigate possible causes. States like Virginia, West Virginia, Washington and Florida that have high scores may provide models.
First, here are the adjusted NAEP civics scores from the most recent year (2018).
And here are changes in those scores from 2014-18.
Another research step would be to add state civics policies (such as course and test requirements) to the model.
*Carlo, Steven Michael. (2024). The State of State Civics Scores: An Application of Multilevel Regression with Post-Stratification using NAEP Test Scores. (EdWorkingPaper: 24-954). Retrieved from Annenberg Institute at Brown University: https://doi.org/10.26300/rn72-q717. See also: the new NAEP civics results; some surprising results from the 2010 NAEP Civics assessment; CIRCLE’s release on today’s Civics results etc.
