- Facebook102
- Threads
- Bluesky
- Total 102
Hillary Clinton is winning the popular vote, and I am seeing commentary to the effect that she has one of the largest vote counts ever received, at nearly 64 million. It’s true that only Obama beat that number (twice, with 69 million and then 66 million votes in his two presidential races). However, the population of the US keeps growing, so one would expect the number of votes cast to rise.
The best measure of popular support is the percentage of all adults who turn out for a given candidate. Clinton got about 28%; 27.1% voted for Trump. The 0.9% gap was one of the smallest in modern times, although 1960, 1968, and 2000 were actually closer races in these terms. Clinton’s share of all eligible voters was the same as Obama’s in 2012 (28%).
There have been thirty major party presidential nominees since 1960, and Clinton ranks seventh among all of them in votes/adult population. A few candidates drew much bigger shares back when turnout was higher and partisan swings were wider. LBJ drew the votes of 37.5% of all adults in 1964, about one third more than Clinton did–but politics has changed since then.
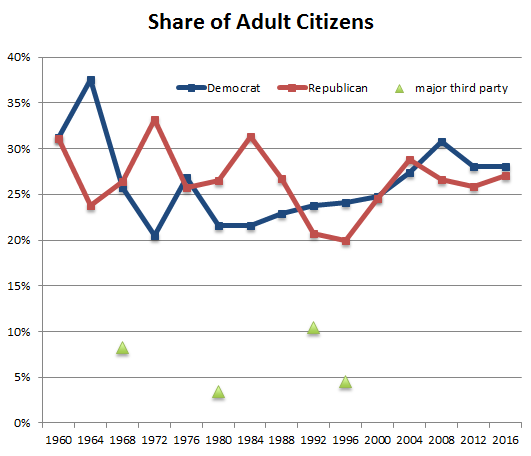
(Major third party candidates are shown for 1968, 1980, 1992, and 1996.)