Category Archives: teaching high school civics (2000-2010)

progress toward an information commons

Since 2002, some colleagues and I have been working slowly to create an “information commons” for Prince George’s County, MD. A real information commons would be a voluntary association devoted to creating public goods and putting them online. These goods might include maps, oral histories, historical archives, news articles, discussion forums, research reports, calendars, and directories. If community groups preferred to maintain separate websites, they could link to features on the commons site and thus “distribute” the commons across the web. The association would also lobby locally on issues like the “digital divide” and broadband access; and would provide training and support. Information commons in various communities would form networks and share software.

So far, the tangible products of the Prince George’s Information Commons are a modest website whose best feature is an oral history, and a series of articles defending the concept of a commons.

We decided not to start by creating an association, because we were afraid that community people wouldn’t see the need for such a body or the advantages of joining. Instead, we hoped to create enough exciting and useful content on one site that it would draw traffic and interest. We would then ask participants if they wanted to “own” the site formally by creating a non-profit governing board.

Progress has been slow for two main reasons.

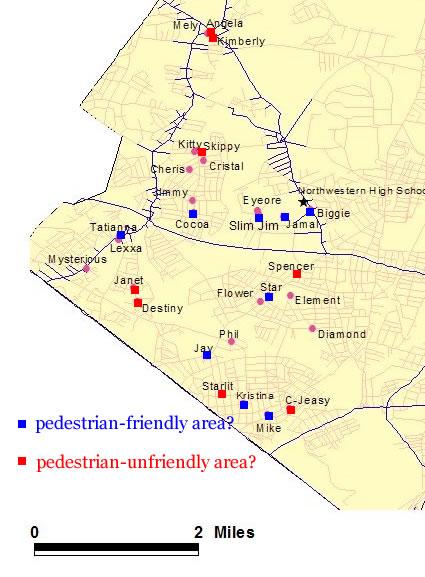
First, we have chosen to work with high school students, and for the most part ones who are not currently on the college track. This has been extremely rewarding work, but it’s also a relatively slow way to generate exciting content. For instance, students spent a whole summer gathering excellent audio recordings that documented immigration into the County, but we haven’t figured out how to use that material online. It sits on a CD. Likewise, the kids took a very long time collecting information for “asset maps,” and the result was a relatively small set of incomplete (and now dated) maps.

Despite the slowness of this approach, I intend to continue to invest the majority of my discretionary time in the high school, because I find it extremely satisfying to work directly with kids.

The second obstacle is financial. We have had great difficulty raising money for the core concept of an “information commons.” Instead, we have raised funds from foundations with specific interests in, for example, history or geography. As a result, we haven’t had money or time to develop the commons itself. Instead, we have lurched from one project to another.

Ideally, we would always be busy with three tasks: 1) teaching high school (or middle-school) students to create digital products for the website; 2) working with college classes, churches, and other adult groups to help them to create content; and 3) installing and managing interactive features for the website itself, such as an open blog, a “wiki,” or a map that visitors could annotate. These features would have to be carefully monitored or else they would be vulnerable to spammers and cyber-vandals.

To date, we have only had sufficient resources to do the first of these tasks, and that only on a small scale. Recently, I’ve been thinking hard about the second job: recruiting independent groups to produce their own content. Based on some recent conversations, I am optimistic that by the spring we will have three groups feeding content into the commons site: the high school class, a college class, and possibly a group of teachers.

food for thought

Here is a strange statistical result. My colleagues and I have been teaching

high school students to investigate the causes of obesity in their communityas

a form of civic education. This fall, they are going to conduct and tape interviews

and create a radio show to publicize their results. To give them some data to

work from,

we surveyed all the students in the school’s health classes. The response rate

was poor, because students had to bring in parental permission slips before they could complete

the survey; and there was no penalty for failing to participate. Nevertheless, we

received enough surveys to draw tentative statistical conclusions. Here is the

one that surprises me. None of the 17 kids who said that they ate fast food

every day are overweight (according to their self-reported combination of height and weight). However, 43% of those who said they eat "hardly

any" fast food are considered clinically overweight.

What’s going on? Maybe a lot of kids are mistaken or dishonest, but it’s strange

that the relationship between fast food and body weight would be so linear and negative. The sample is too small for serious statistical analysis,

but we noticed that immigrant kids are more likely to eat fast food, yet less

likely to be overweight. So maybe immigrants eat good food at home but go out a lot

to McDonalds.

There are more possible explanations. For instance, the Washington Post’s “Kid’s Post” section reported last Wednesday that young people order less healthy food at restaurants like Outback Steakhouse and Red Lobster than they do at fast-food places. So maybe it’s good to go to McDonalds if it keeps you from ordering the “surf and turf” at a sit-down restaurant. But most of the kids we surveyed cannot afford regular visits to real restaurants.

In any case, the students’ research task is a lot harder because of this result.

geographic information systems (GIS) in civic ed

Yesterday was our last class at the high school for this academic year. We brought along some maps (based on data that the students had collected) that showed aspects of the community that may affect young residents’ health. In particular, the maps show that kids who walk are clustered in certain areas; thus some neighborhoods may be built in ways that are friendly to pedestrians. That would be an important finding, because we know that walking reduces obesity, and obesity is a big health problem. Our students are alert to possible causes of error (the small sample, selection bias, hidden causes, etc). We would have to do a lot more research before we could draw any rigorous conclusions.

Today I took an excellent intermediate-level class on GIS software and became increasingly excited about what we can do with the class when we resume next fall. We’ll certainly ask them to collect more data about their fellow students’ behavior and locals assets such as stores and parks.

It’s exciting to address an issue (obesity) that’s usually seen in strictly pyschological terms–as a matter of body-image and will-power–and to look instead for geographical causes. Active citizens can potentially change the local landscape and zoning laws, whereas body-image and eating habits are very hard to change. Meanwhile, GIS software is making it possible for kids who don’t have very advanced skills to understand their environment in tremendously powerful ways.

map work

As regular readers know, my colleagues and I have been helping high school students to conduct fieldwork and make maps of their community. They are trying to understand how features of local geography may affect behaviors that, in turn, affect health. We and the students have collected mountains of data of various kinds: questionnaires, focus group notes, notes from “window tours” of the neighborhood, GIS data collected with Palm Pilots, ratings of local food sources, and more. Most of the data is incomplete and not yet suitable for drawing conclusions. Nevertheless, we need hypotheses so that we can narrow our focus.

Here’s a map, generated from the students’ data, that suggests some ideas for our kids to pursue more rigorously. Each name is a pseudonym of a real student in our class.

The blue squares show students who appear to live in pedestrian-friendly areas. They say that they walk for exercise, they report that their neighbors walk a lot, and they say that it’s safe to walk near their homes during the day.

The red squares mark students who answered “no” to at least two of the same questions, so they appear to live in pedestrian-unfriendly zones. The remaining dots mark students who gave mixed answers or no answers at all.

The cluster of red squares near the top of the map includes three young women of Caribbean ethnicity who live in single-family homes. Two of them say that it’s safe to walk, but none say that they or their neighbors walk. (In general, females in our sample are less likely to report that their neighborhood is safe, but more likely to walk even if they feel unsafe.) The cluster of blue squares near Northwestern includes four African American young people, all apartment-dwellers, who walk and feel that walking is safe and common. There is a positive correlation between being African American and walking, in our small sample.

The real purpose of all this work is civic education–to teach students to understand and care about their communities, by engaging them in real research. This approach to education requires that we take their research questions very seriously ourselves. Although most of the information we have collected so far is simply confusing, I remain hopeful that we and our students can generate truly innovative findings about the effects of urban planning on health.

making maps

Yesterday, in the late afternoon, I was back on the streets of Hyattsville, MD, mapping the neighborhood by entering data into a Palm Pilot pocket organizer. This week, unlike last, we had a large group of high school students with us, as well as five adults. Even though it was as hot and humid as August, and even though there are no sidewalks on many of the busy roads, we managed to cover some ground and enter a lot of data into our organizers.

We have also collected data on about 50 kids–where they live, what they eat, where they get their food, and how and when they exercise. In addition, we have general Census data on the neighborhood. What we need at this point is a strong research hypothesis about the relationship between urban form and healthy behavior. We could continue collecting street-level data about types of businesses, sidewalk and street safety, and residential housing for years. It has been good to map some areas intensively, because we’ve learned how to collect and manage data (and how to get kids safely from A to B). But we need to focus on some compelling issue or finding; otherwise, we’re going to run out of motivation. Ideally, the kids would come up with this focus. We will certainly consult with them, but we have so little time with them that I’m afraid the adults are going to have to develop the main ideas. As soon as I get some time, I’m going to sift through what we’ve collected and look for patterns.