For CivXNow, we recently created a System Map of k-12 civics. Perhaps the greatest value of the map is that we didn’t decide what was on it or how things fit together. More than 7,500 people co-created it by answering survey questions. We didn’t ask them what strategy they favored but whether they thought that various specific factors influenced other specific factors, and we built a network from the results. More about the method and its rationale is here.
In this post, I would like to derive some substantive results from the map.
First, look at what is connected to two different possible outcomes of civic education: youth knowledge (on the left) and youth civic engagement (on the right). Almost the whole map has direct connections to knowledge; very little is connected to youth engagement. Of the causes of youth engagement, one is knowledge–which sends us back to the diagram on the left. Another cause is “schools are [generally] effective institutions,” which may seem beyond the power of the civic education community.
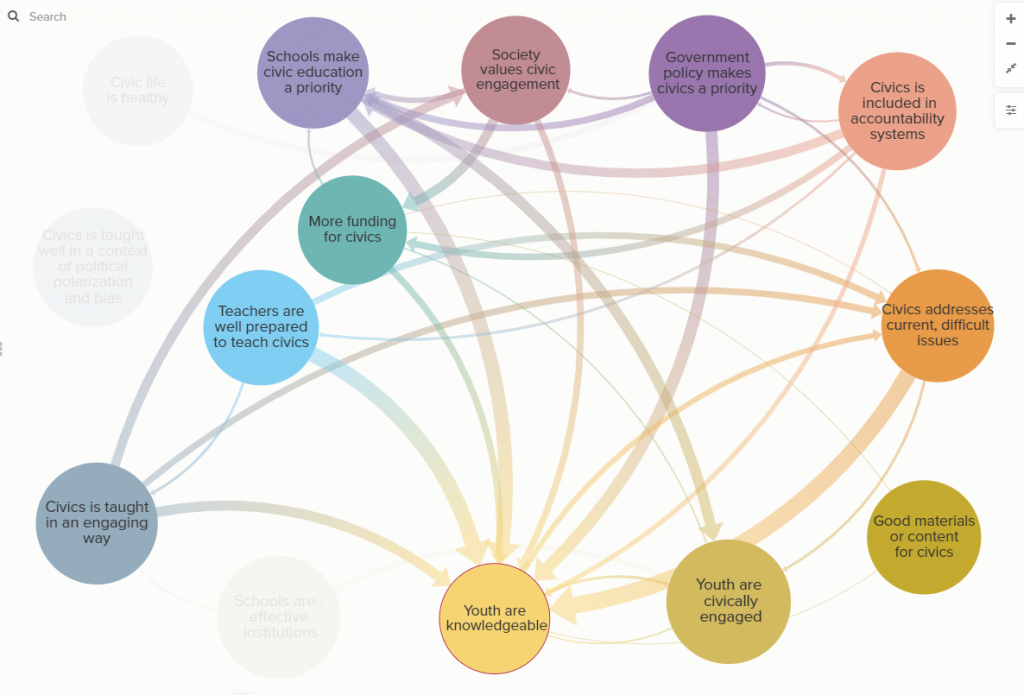
Outcome: Youth are Knowledgeable 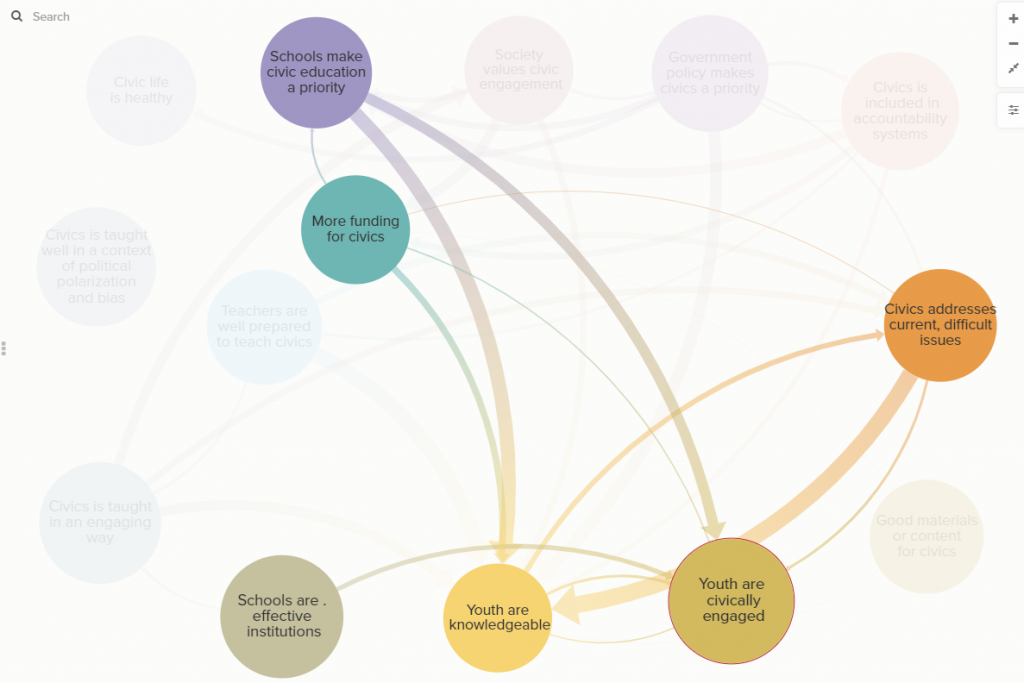
Outcome: Youth are Engaged
Overall, it appears that we have created much more of a “system” for generating youth knowledge than for empowering youth to act. To the extent that people are working on the latter goal, their efforts are not nearly as visible to our 7,500 respondents.
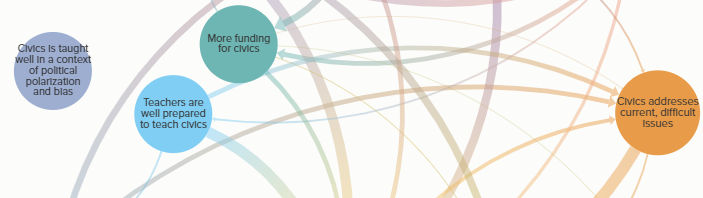
Second, compare two factors that have to do with the content and pedagogy of civics. On the left is whether civics addresses complex and current issues and controversies. On the right is whether teachers are able to present civics without bias and withstand a polarized political environment outside the classroom
Civics Addresses Complex, Current Issues 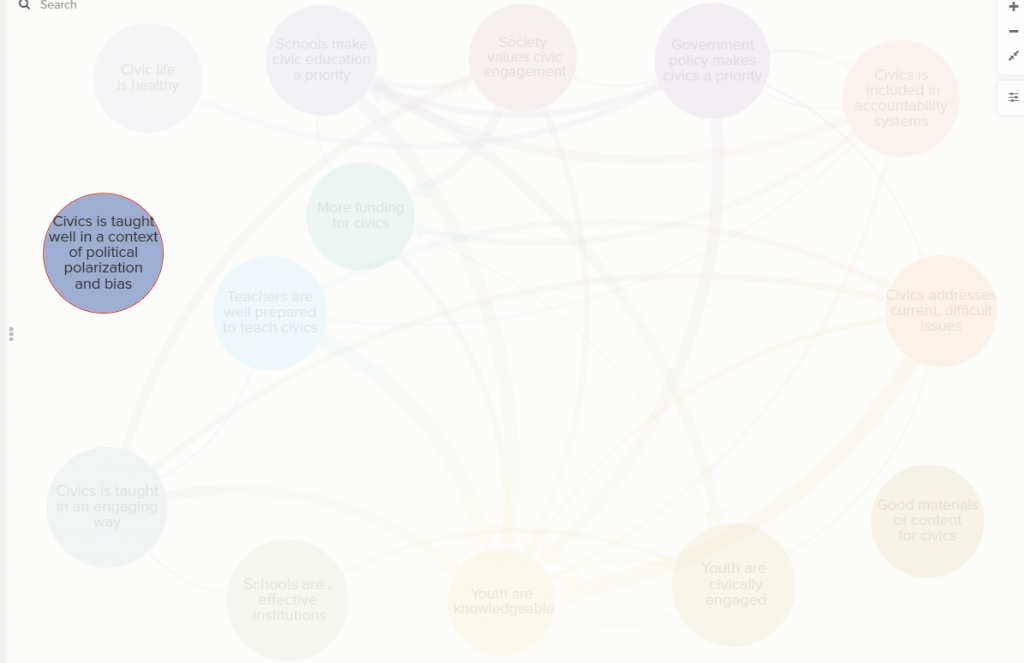
Civics is Well Taught [Despite] Polarization and Bias
Either goal may be very important. You might reasonably consider either (or both) to be your main concern. But the one on the left is highly leveraged, affecting many other outcomes. The one on the right has virtually no leverage at all. Our community doubts that if civics avoided problems of bias, then anything else would improve.
Third, take a look at funding. This was linked to more other factors than any other node on the map. I assume that is because it is relatively easy to envision that having more money would change a whole range of outcomes. We all know that money has value. (That’s why they call it “money.”)
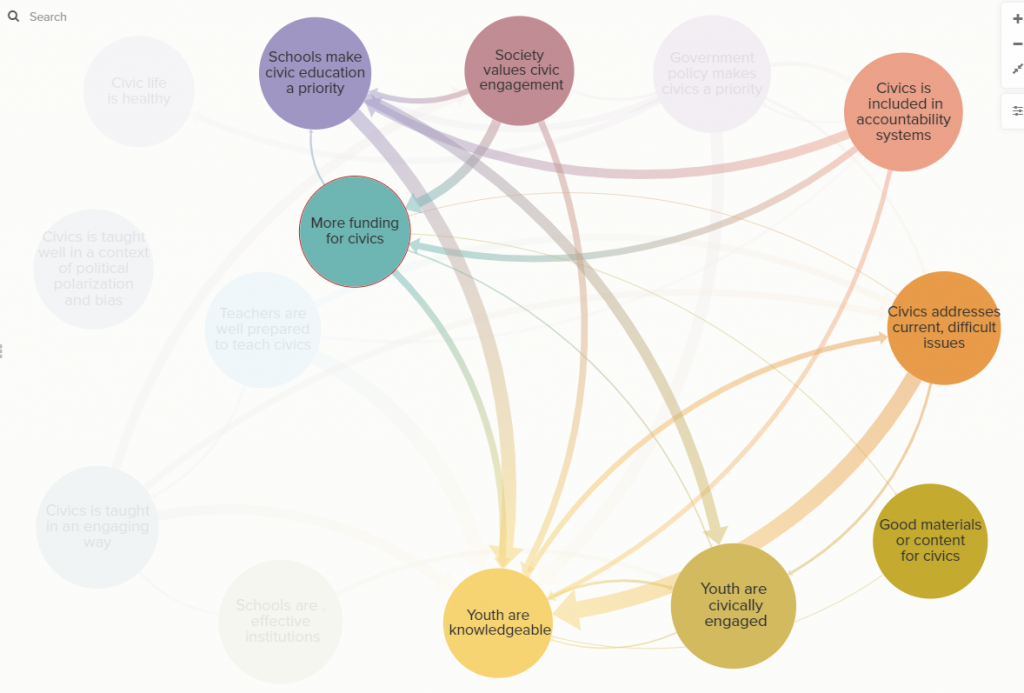
But how would we get more money? This map rightly portrays funding as a “midstream” issue. Yes, money would help, but other factors–notably, including civics in accountability systems and making civic engagement more of a public priority–are what would yield more funding. The map suggests that even if money is an important means, it is likely not the best target for advocacy.
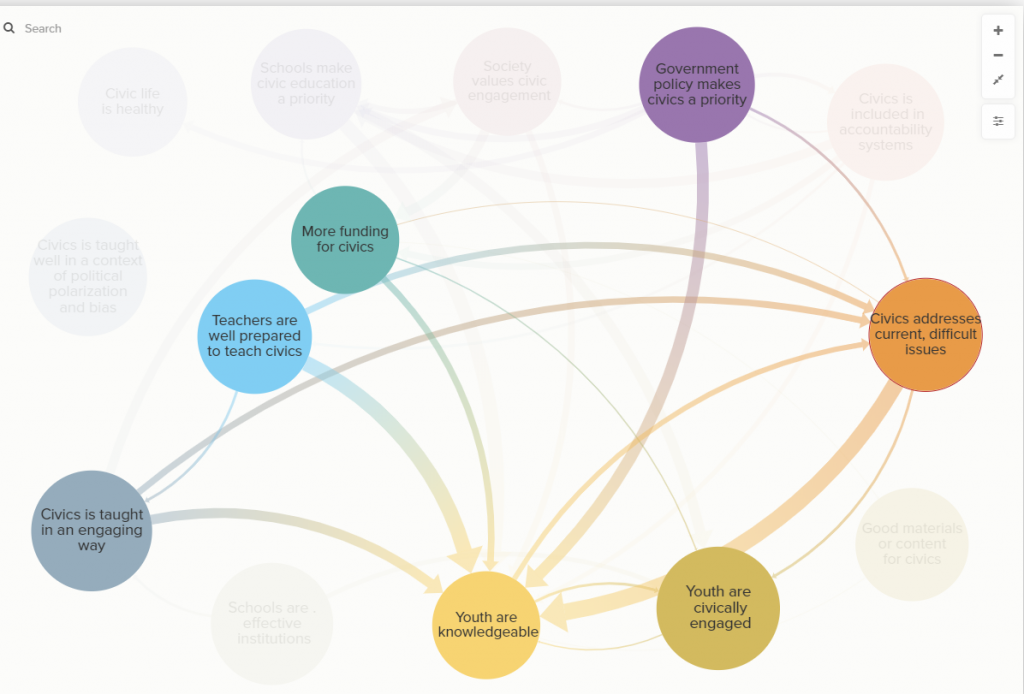
Now take a look at how people connected “Teachers are Well Prepared to Teach Civics” to other nodes. This is the factor that captures pre-service education, professional development, etc. Respondents did see it as a driver of more engaging pedagogy and of more current issue-discussions. But the ultimate outcome they expected was better knowledge, not more civic engagement.
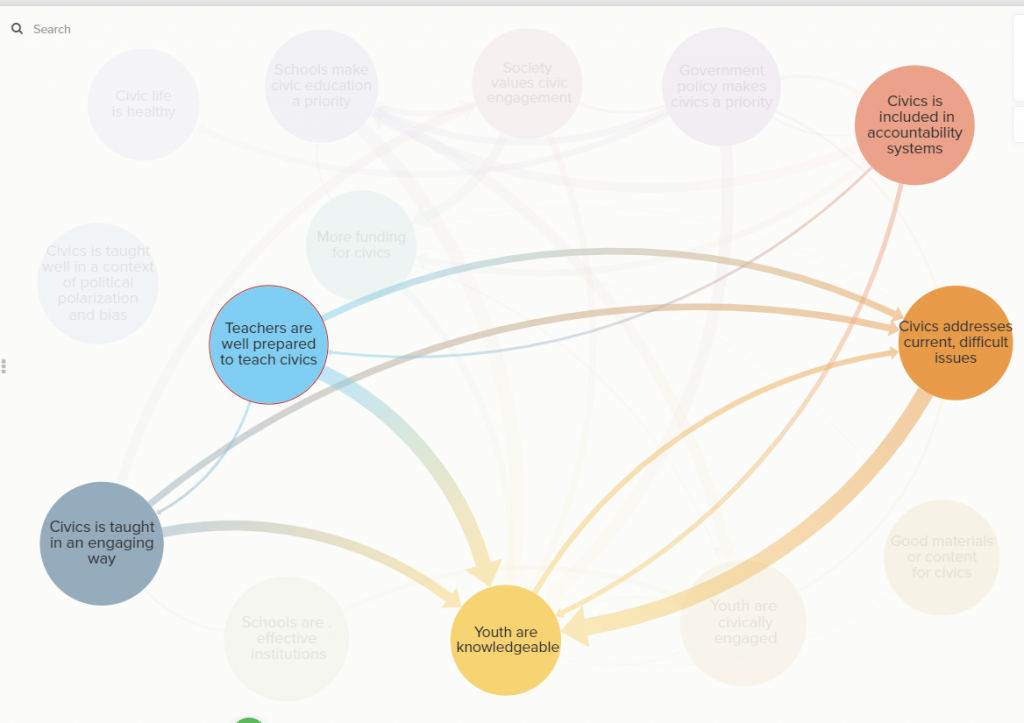
This could mean that most teacher education and PD presents student knowledge as the explicit goal, and engaging pedagogy as a means. Should it be otherwise?
Finally, let’s zoom in for greater detail. This is a screenshot from the version of the map that displays 75 components clustered into larger factors. I have highlighted the components that may reflect a concern with history and classic texts (often coded as conservative) and those that reflect a desire for students to take action (sometimes seen as progressive).
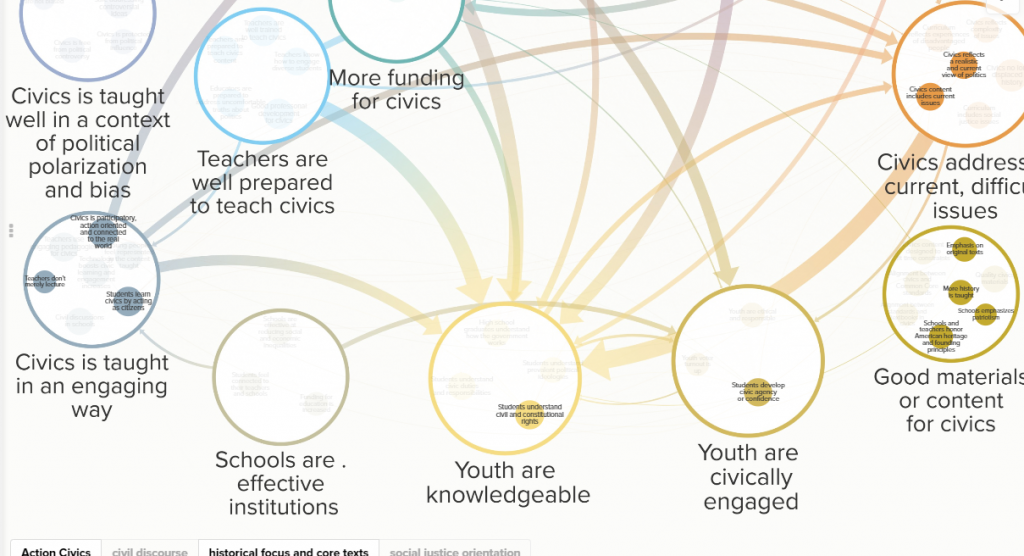
The point I would like to emphasize is that these goals are not in conflict. They light up different parts of the map. It’s possible to work on both goals at once.