Most trees have leafed out for two or three days.
Each leaf unfolding in place to fill its space, green;
But the trees that flowered are wilting now,
Bold blooms shrinking to leave more space between,
Dwindling to stipples along each bough.
Superimposed: a lacy screen, damascened,
Patches on a slate background--the dripping sky--
Grey except at some hidden place where a break
Must let the sun flood up to certain high
Shingles, a wire, a spire that's a streak
Of brilliant white. All silent, a still sheen,
Sheer, stretched thin to fade or end in a blaze.
It was a different time. Also a different place: I wrote it in our usual home in Cambridge, MA, but we have been sheltering for weeks in West Tisbury on Martha’s Vineyard.
I will say one thing for the poem: it is precisely described. “Wire” and “spire” are convenient rhymes, and they probably look forced, but I actually watched the slender white spire of Memorial Church and a telephone wire, both lit from below by a band of setting sun breaking through low clouds.
I am sharing this survey invitation by request and would encourage you to send it to middle-school or high-school students you know, including those in schools or programs where you work (if their own policies allow).
I would like to invite you to participate in a survey on how adolescents are understanding and processing what COVID-19 means to humanity and their societies, as well as thinking about themselves, their societies, and their future trajectories and opportunities during the COVID-19 global crisis. I want to know more about your perspective on what is going on, and your participation is valuable to helping better understand what impacts the changes related to COVID-19 have on young people.
The study is being conducted by myself, Gabriel Velez, with the approval of the Marquette University Institutional Review Board. You are eligible to participate in this study because you are a middle or high school student.
If you decide to participate in this study, you will be asked to complete an online survey of approximately 20 to 30 minutes. Your answers will be recorded, but they will only be connected to your name if you provide us with your name to be contacted for a follow up survey. Your responses will not be shared with your school. At the end of the survey, we will ask for your email address if you are willing to participate in a follow up interview with a researcher.
In order to participate in this survey, you will have to give your informed consent. If you are under 18 years old, you will also need your parents to indicate that they give you permission to participate. When you click the link to the survey, the first page will be for you to read and agree to. The second page will then be for your caregiver, and they should read it over and click that they give permission for you to participate.
Remember, this is completely voluntary. Your decision to participate or not will not be known by anyone at your school or affect your relationship with your school or with any school personnel.
You can choose to be in the study or not. If you’d like to participate or have any questions about the study, please email Gabriel Velez (Gabriel.velez@marquette.edu).
Thank you very much. Sincerely, Gabriel Velez Marquette University College of Education
This is just a salvo in the current debate about whether the feds should send money to states:
“It’s not fair to the taxpayers of Florida. We sit here, we live within our means, and then New York, Illinois, California and other states don’t. And we’re supposed to go bail them out? That’s not right,” GOP Sen. Rick Scott tells poolers of sending more money to states— Burgess Everett (@burgessev) April 27, 2020
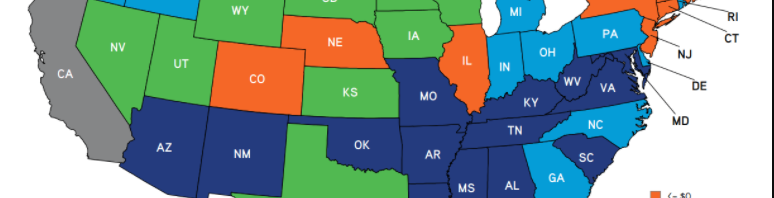
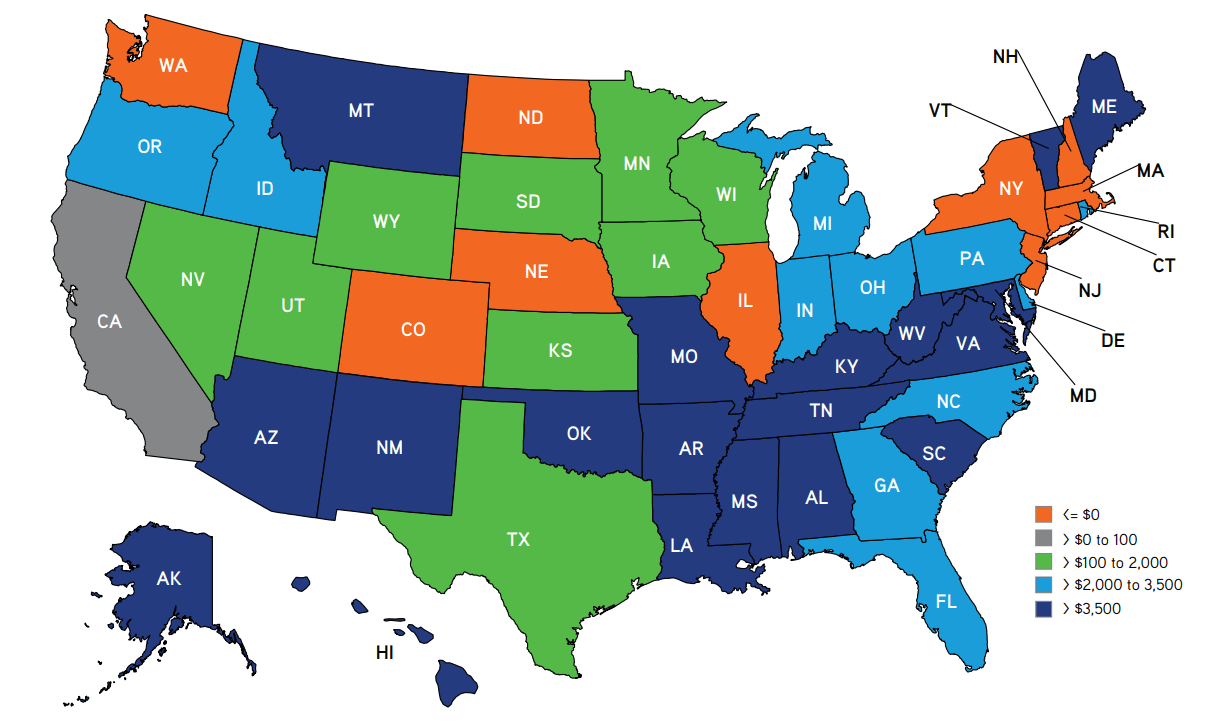
The Rockefeller Institute calculates the net flow of money from state to state on a per capita basis. Note that net money flows from New York and Illinois (although not actually from California) toward Sen. Scott’s Florida (h/t Jonathan Cohn).
But this is as it should be. The progressive position should be that people in the band of states from Pennsylvania to Arizona deserve support from states like New York, Massachusetts, and New Jersey. It is not a matter of noblesse oblige or the kindness of Yankees. Wealth is concentrated in places like Manhattan and Boston. These places are home to many rich individuals and concentrations of organized capital. Progressives believe that concentrated capital is problematic. At a minimum, it distorts power. At the worst, it is exploitative, expanding at the expense of people in Alabama or New Mexico. People in those states have a right to a larger share of the national wealth.
It’s OK to make fun of conservative politicians from recipient states who won’t acknowledge that they benefit from federal redistribution.
It’s important to think about why people in recipient states often vote against redistribution while people from supplier states may vote for it.
There is also a troubling paradox that the political party that is at least mildly more favorable to redistribution draws so much of its votes from states that lose out from redistribution. From William Jennings Bryan to Lyndon Baines Johnson, the states that wanted a strong federal role in the economy were net recipients of federal aid, and they viewed Wall Street as their enemy. Now the Senate Democratic Leader, the nation’s most prominent Democratic governor, and the 2016 Democratic presidential nominee all directly represent Wall Street.
These are paradoxes and conundrums, but the best response is not to object to the interstate flow of money, to mock Red State politicians for mischaracterizing it, or to ask people in poorer states to be more grateful for the help they get from the north. The right response is to reinforce public support for the social contract that rightly sends money from Massachusetts to Mississippi.
Today, the National Assessment Governing Board released new results for social studies subjects from the National Assessment of Educational Progress (NAEP). EdWeek says, “8th Graders Don’t Know Much About History, National Exam Shows.” Betsy DeVos calls the findings “stark and inexcusable.”
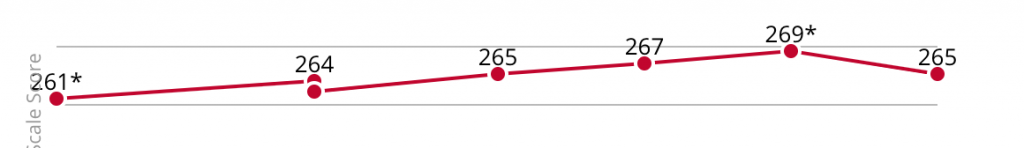
History and geography scores fell, although I don’t know if I’d agree with EdWeek’s Stephen SawchukandSarah D. Sparks that “Eighth graders’ grasp of key topics in history have plummeted.” Here are the median history scores over time:
I would probably say that history scores “declined to a significantly significant degree compared to 2014, meaning that the change from 2014-18 is unlikely to reflect sampling bias.” The differences between 2018 and all other years are within the margin of error and therefore may not be improvements or declines at all.
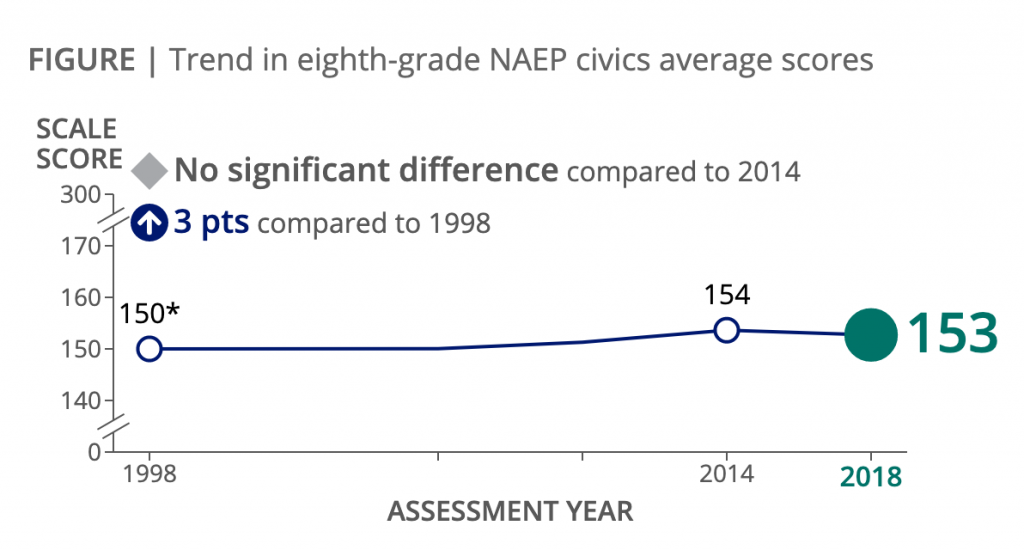
Civics is my own field of interest, and I was one of the designers of the NAEP Civics Assessment instrument. The results for Civics were flat. (Unless you want to say that they “plummeted” by one point.)
The NAEP is extraordinarily useful for analyzing differences in scores by demographic group and for understanding how educational experiences (e.g., taking an 8th grade civics course) relate to outcomes. Unless you have worked with the dedicated folks at the Educational Testing Service and the National Assessment Governing Board, you cannot imagine how careful they are about test-design and implementation or how complex the whole process is.
However, as in the past, I would like to offer these caveats about the NAEP results and the surrounding commentary.
First, as noted above, the changes are subtle, and some are within the margin of error. There is no evidence here of dramatic decline.
Second, the definitions of “proficient” and “advanced” are basically arbitrary. The 1998 designers chose scores that would count as “proficient,” based on their own judgment. Based on the data from that year, they said that just 22% of American 8th graders were proficient. They must have been aware that they would communicate a message of crisis.
The subsequent Assessments have been normed to the 1998 instrument. Roughly speaking, if we drafted an instrument that indicated a major improvement, it would probably not be fielded as such, because the high scores in the pilot phase would suggest that it was an invalid measure–the questions must be too easy.
Therefore, it isn’t really news that the proficiency level is in the neighborhood of 25%. That is how the test is designed. This is not to say that we can’t gradually boost it to 30% or higher if we make a lot of progress in classrooms. But you should understand why the numbers could not be much higher.
The judgment that most kids are not proficient is subject to debate. If you look at the actual questions and how many 8th graders got each one right, you may conclude that most students are below proficient. Or you may think that the questions are surprisingly hard and that we are expecting a lot from 13-year-olds.
For instance, 50% answered this item right:
The United States Congress can pass a bill even if the President disagrees with the bill because
Congress must make sure that the needs of all citizens are met
Congress can make laws more quickly when it does not have to involve the President
Congress usually knows more about what the laws mean than the President does
Congress is the primary legislative power of the government
Is 50% a terrible result, or not too bad? That is a matter of judgment and expectations, not statistics.
Third, the NAEP measures some things but not others. The Civics assessment includes many items about the structure of the US government–which branch or level has what authority. It excludes current events, value-commitments (such as patriotism or commitment to equality), items about social issues, detailed questions about civic institutions outside of government (e.g., What does a PTA do?), items about specific state and local governments, and measures of students’ civic activity outside of school.
Finally, it is difficult to separate reading from civics, particularly at the 4th and 8th grade levels. I don’t think anyone does that better than the NAEP does, but it’s an intrinsic challenge.
A kid who hasn’t actually learned anything specific about the US government but is used to reading advanced texts–The Lord of the Rings, for example–could glean a lot of correct answers based on the meaning of words like “primary” and “legislative” in the example above. A different kid who has dutifully learned some specific civics content might be thrown by the language of the Assessment, especially when the prompts contain longer passages.
It is true that literacy is a civic asset and that people who can do a lot with words are better prepared for civic life. However, if we think there is a separate domain of civic learning–as I do–then measuring it with a written instrument that isn’t confounded with literacy is a challenge.
Overall, I believe there is valuable information in the NAEP (and it’s important for Congress to fund it regularly). But the headlines are hyped. The data show evidence of stability in the relatively narrow set of outcomes that the Assessment measures, with the caveat that the test is designed to be stable over time. If we want to improve civics, we should focus mainly on what helps various kinds of kids to learn the various domains of content that are on the test–plus the important outcomes that the NAEP does not measure at all.
The situation is fluid and unpredictable, but it’s worth tracking these developments.
Lots of philanthropy for COVID-responses. The Foundation Center and GuideStar are tracking $7.9 billion in philanthropic commitments (so far) that specifically address COVID-19. You can find extensive detail here.
Lots of creative new forms of collective action and dissent under pandemic conditions, including protests in which participants stand far apart or ride in cars, refusals to go to work, etc. This crowdsourced list* is admirably broad, encompassing everything from pure service efforts (e.g. sewing masks) to adversarial politics, and ranging from evangelical pastors holding services in defiance of meeting bans to pro-ban parishioners protesting such pastors.
I continue to think that the problem for civil society will not be the pandemic; it will be the depression. If you can resume pre-COVID values, priorities, methods, and habits once the pandemic eases, you will. But many people will not be able to do so because they will have lost their jobs in civil society or their ability to afford civic activity. Still, some of the creative ideas that we’re seeing under the current extreme conditions may prove durable.