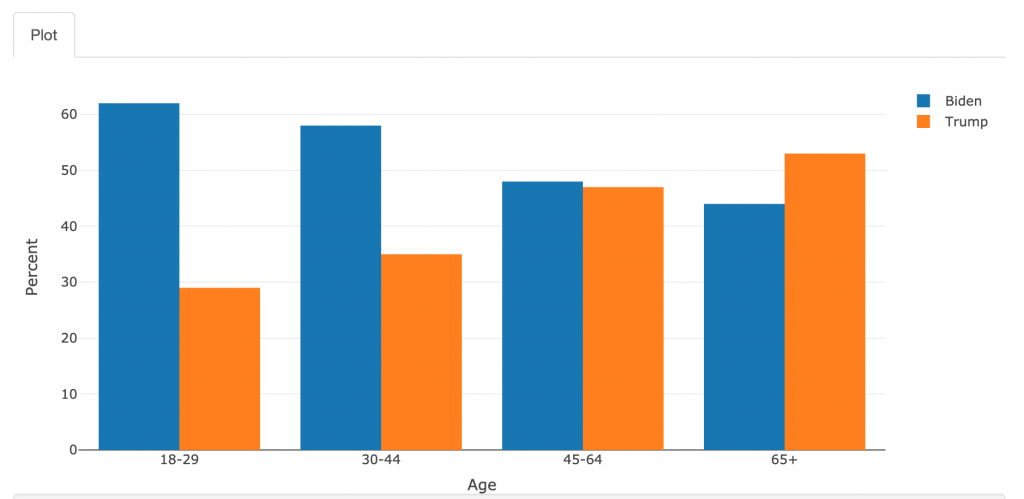
Category Archives: 2020 election

youth voting 2020: Tisch College analysis so far

This is your regular reminder to follow Tisch College’s CIRCLE (@civicyouth) for the best data and analysis on youth voting. A list of their recent releases follows. They will have lots of timely data as the actual election unfolds.

Brian Schaffner is also part of Tisch College. He co-leads the Cooperative Election Study (previously the CCES), which surveyed 71,789 people between Sept. 29th and Oct. 27th. (That is an enormous sample). His analysis of the likely voters in the CES shows why the youth vote is pivotal.

2020 CES Presidential vote preferences (likely voters)

Meanwhile, follow Tisch’s Institute for Democracy and Higher Education for detailed information on college students, our Metric Geometry and Gerrymandering Group for research on districting, and our Center for State Policy and Analysis for Massachusetts-related information, including work on the ranked-choice voting ballot initiative here.

how Trump and Biden supporters think about their identities

We surveyed a nationally representative sample of 1,267 Americans from May 29-June 10, 2020. Biden led by 50.5%-37%. That result is now far out of date. However, respondents answered more than 350 questions either in this survey or in surveys that they had taken previously. As a result, we are able to look at many more attributes of the electorate than in a typical political poll: matters like which chronic diseases Biden and Trump supporters have, whether they donate money to colleges, how they define their identity, and whether they have pets. (In case you’re wondering, Trump voters are 8 points more likely to have pets.) Given the remarkable stability of the race, I am confident these patterns still apply.

This new article on the Equity Research website provides a lot of detail. Here I’ll just share the portion about identity. All the statistics reported here are for likely voters: those who rated their own chances of voting in November 2020 as seven or higher on a 10-point scale.

Only 10% of whites said that race was important to their own identity (or “salient”). Among that group, Trump led by 61.5%-31%, whereas Trump’s lead among other whites was just 5 points (47%-42%–less than a majority).

More than half of African Americans (57%) said that their race was salient, and those African Americans supported Biden over Trump by 96%-3%. The margin was somewhat closer (80%-10%) among African Americans who did not report that race was salient

About one third (31%) of Latinos said that race was salient, and they favored Biden by 67%-23%. Among the majority of Latinos who said that race was not salient, Biden’s margin was somewhat narrower (60%-19%).

Biden led narrowly (48%-42%) among women who see gender as salient, but by a wide margin (52%-30%) among those who do not. Women who see gender as salient were also more likely to identify as conservative compared to women who do not see gender as important to their own identity (26% versus 18%). It appears that women who see gender as salient are more often expressing traditionalist views of gender rather than feminist views. Biden also performed better among men if they did not see gender as important to their identities.

Twenty-eight percent of voters reported that religion was important to their identity. Trump led 58%-31% among those voters, whereas Biden led by a similar margin, 58%-29.5%, among voters who did not see religion as salient.

As shown in Fig. 1, Biden led among all categories of people who felt that class was not important to their own identities, and especially among those in the lowest and highest income categories who felt that way. Trump led by substantial majorities among people who felt that class was important to their identities and were in either the low- or high-income brackets. In other words, Trump led among working-class people who identified with their class and among wealthy people who identified with their class.

More on the Equity Research website.

where youth will make the most difference

CIRCLE‘s Youth Electoral Significance Index (YESI) shows where young people are likely to have the most influence on the outcome of the election. The goal is to encourage investment in the youth vote, at least in those places.

CIRCLE has crunched the latest data to produce the final, revised YESI, with these changes since the last time:

  • Georgia: In our presidential rankings, several states moved up or down one or two spots and, notably, Georgia replaced Maine on the #10 slot. Georgia’s recent emergence as a battleground state also informed our Senate rankings. The state has two Senate races in 2020 and the one for the seat held by Kelly Loeffler was #8 in our earlier rankings; the updated version sees that race move up to #7 and the race for David Perdue’s seat enter the top-10 at #6. 
  • Alaska: The Alaska Senate race also makes it into our updated rankings (at #10), while Kansas and Alabama (#9 and #10, respectively, in the previous ranking), drop out of the top 10 entirely—though just barely, as they’re now ranked 11th and 12th.
  • House of Reprensetatives: In our ranking for U.S. House races, the Georgia 7th climbed from #5 to #3 and the Georgia 6th, absent from our previous ranking, is now the #10 race. The Utah 4th and the New Jersey 3rd drop out of the top 10, while the Virginia 7th enters at #8.

This map shows the Senate YESI, but click through for much more detail on the House, the Electoral College, and specific races.

party identification and ideology over time

Jeffrey Jacobs of Gallup writes, “U.S. Party Preferences Have Swung Sharply Toward Democrats.” And Gallup’s Lydia Saad reports, “Americans’ ideological bent has shifted in the first half of 2020 with fewer people self-identifying as politically conservative in May and June than at the start of the year. There has been a corresponding increase in self-described liberals while the percentage moderate has been fairly steady.”

Here is the evidence:

These reports of 2020 Gallup polls made me curious about the longer term trend. Here are Gallup results for party ID since 2004.

And here are the trends for conservatives and liberals, showing one annual result for every year until 2019, and then the three polls this year:

(By depicting the ideology data this way, I have made 2020 look uniquely volatile. I can’t find more data points before 2020, but I’m sure the lines would zig-zag more.)

A few observations:

  • Many more Americans are always comfortable calling themselves conservatives than liberals. It is not the case that many people place themselves left of liberal or identify as “progressives” instead of liberals, because almost everyone picks either conservative, liberal, or moderate. However, the content of those labels shifts. To be liberal in 2020 means different things than it meant in 1992, and that is where the left has a greater advantage.
  • The beginning of 2020 was one of the peaks for conservative identification. The level this June was typical.
  • Republican identification in June 2020 (39%) was lower than it was in 82% of Gallup’s surveys since 2004, but it was not unprecedented. Republican identification was at 36% as recently as January 2019.
  • Democrats have a longterm advantage in party ID. Republicans have been ahead in 12% of Gallup’s surveys since 2004.
  • Each party tends to get more support when the other one holds the presidency, but George W. Bush boosted Democratic identification more than Barack Obama helped Republicans. Bush also did more damage to his own party than Trump has done to his, so far. However, I think the bottom may well fall out for the GOP between now and the end of the year. They could reach the same level as in fall 2006, when they trailed the Dems. by 56%-34%, and Nancy Pelosi became Speaker.

some highlights from the new CIRCLE survey

CIRCLE’s new survey of 2,232 young citizens (ages 18-29) is out. Among the findings:

  • “83% say they believe young people have the power to change the country, 60% feel like they’re part of a movement that will vote to express its views, and 79% of young people say the COVID-19 pandemic has helped them realize that politics impact their everyday lives.”
  • They support Biden over Trump by 58%-24%, “a staggering 34-point margin. But 18% of youth say they would like to vote for another candidate. Asian youth (78%) and Black youth (73%) are the most likely to support Biden. Meanwhile, almost three quarters of youth who support Trump (72%) are White.”
  • 27% of young people (ages 18-24) say they have attended a march or demonstration, a remarkable increase from when we asked the question [of] the same age group before the 2016 and 2018 elections (5% and 16%, respectively).”
  • For all youth, the top issues are environment and climate change (13%), racism (12%) and healthcare (12%). For Black youth, the priorities are racism (22%), policing of communities of color (15%), and healthcare (11%).
  • All measured forms of political engagement are up compared to 2018 (admittedly, not a presidential year). For instance, half say that they have tried to convince someone else to vote–which is a lot of viral marketing for the election.

Much more information is on the CIRCLE page.