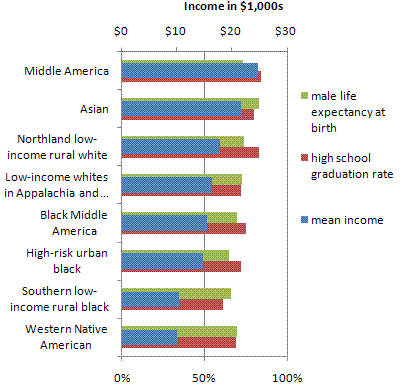
Christopher Murray and six colleagues have published an article entitled “Eight Americas: Investigating Mortality Disparities across Races, Counties, and Race-Counties in the United States.” They divide the entire US population into the following categories:
1. Asian: Asians living in counties where Pacific Islanders make up less than 40% of total Asian population
2. Northland low-income rural white: Whites in northern plains and Dakotas with 1990 county-level per capita income below $11,775 and population density less than 100 persons/km2
3. Middle America: All other whites not included in Americas 2 and 4, Asians not
in America 1, and Native Americans not in America 5
4. Low-income whites in Appalachia and the Mississippi Valley (with 1990 county-level per capita income below $11,775)
5. Western Native American: Native American populations in the mountain and plains areas,
predominantly on reservations
6. Black Middle America: All other black populations living in countries not included in
Americas 7 and 8
7. Southern low-income rural black: Blacks living in counties in the Mississippi Valley and the Deep South with population density below 100 persons/km2, 1990 county-level per capita income below $7,500, and total population size above 1,000 persons (to avoid small numbers)
8 High-risk urban black: Urban populations of more than 150,000 blacks living in counties with cumulative probability of homicide death between 15 and 74 [years] greater than 1.0%
Disparities in life expectancy are enormous–for example, women in America 1 outlive men in America 8 by 20 years. It is illuminating to view these empirically-derived categories instead of the usual baskets (such as White versus African American). Below is my chart of selected disparities from the article: